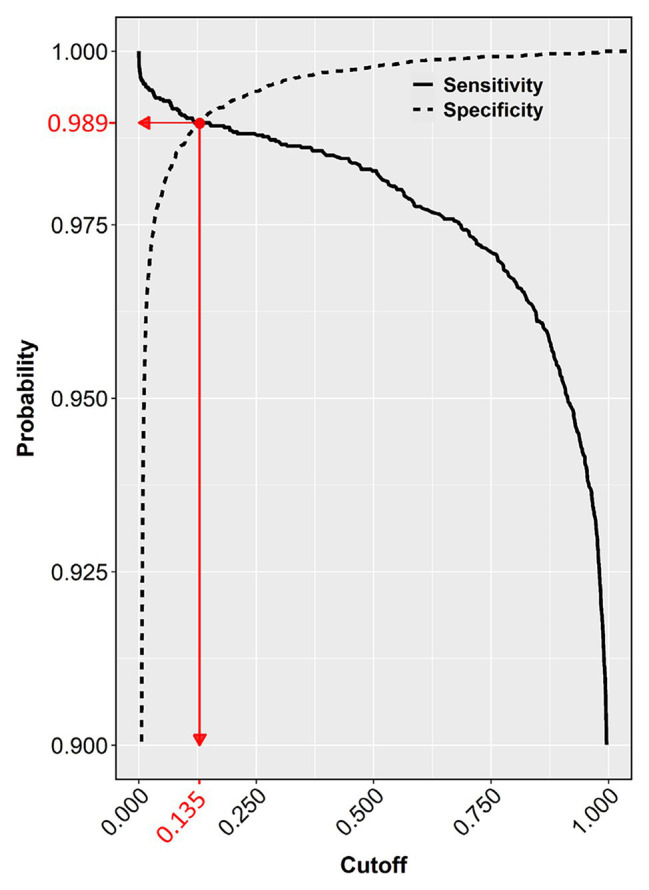
Figure 6.

Sensitivity and specificity of the test dataset across the entire cutoff range (0–1). The crossing point (red dot) of the two curves indicates the selected cutoff value (0.135), at the zenith of the TP (0.9888) and TN rates (0.9882), which corresponds to the nadir of FP and FN rates (1 − 0.9882 = 0.0118 and 1 − 0.9888 = 0.0112, respectively).
