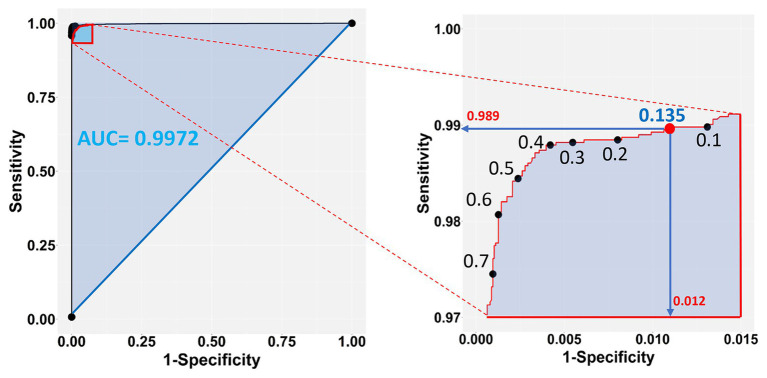
Figure 7.
Sensitivity vs. 1-Specificity (FP) plot of the test dataset (left panel), zooming into the top left-hand corner of the plot region (right panel). The blue shaded part of the plot in the left shows the Area Under the Curve (AUC). The selected cutoff of 0.135 (red dot) corresponds to a 98.9% success rate of TP and 98.8% (1 − 0.0118) TN predictions.

