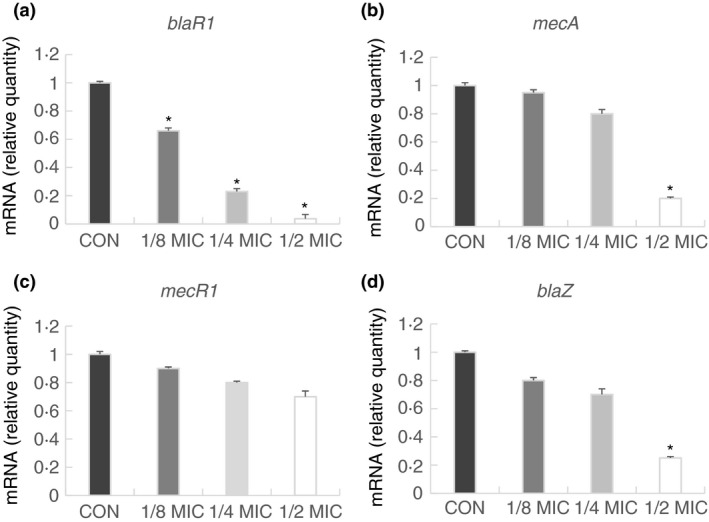
Figure 2.

Relative gene expression of blaR1, mecA, mecR1 and blaZ in Staphylococcus aureus (ATCC 33591) after growth at various concentrations of sanguisorbigenin. The relative gene expression of blaR1 (a), mecA (b), mecR1 (c) and blaZ (d) was reduced in a dose‐dependent manner. Values represent the mean and standard error of three independent experiments. *represents P < 0·05.
