
FIGURE 4.
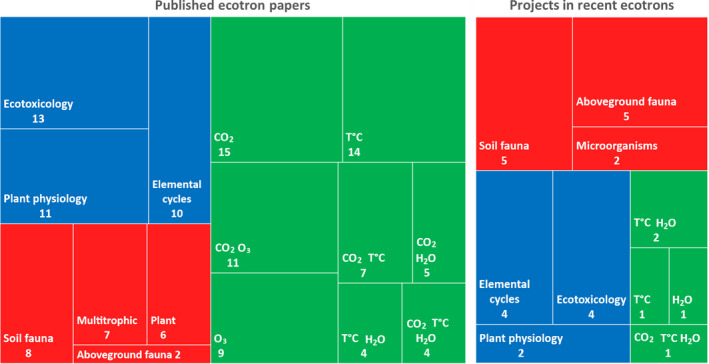
Treemap diagrams showing the research areas covered by the ecotrons in the published ecotron papers (left) and in the running or recently completed projects in the newly open ecotrons (right). Blue: experiments designed to better understand specific ecosystem processes; green: global change experiments simulating ‘novel’ future environments; red: biodiversity experiments with manipulations at various trophic levels. Numbers indicate the number of papers/experiments in each sub‐category