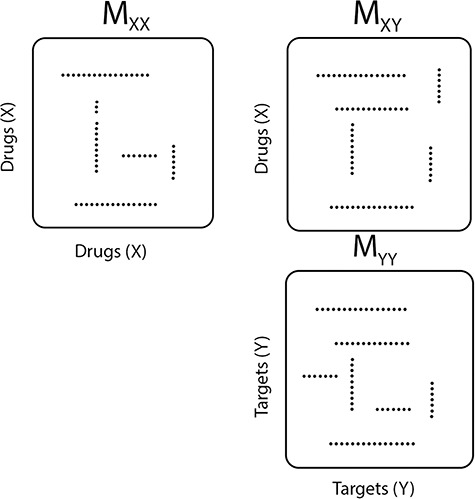
Figure 1 .

An illustration of a sparse coupled drug–drug,  , drug–target,
  and targettarget,
  , matrices representing the interactions.

An illustration of a sparse coupled drug–drug,  , drug–target,
  and targettarget,
  , matrices representing the interactions.