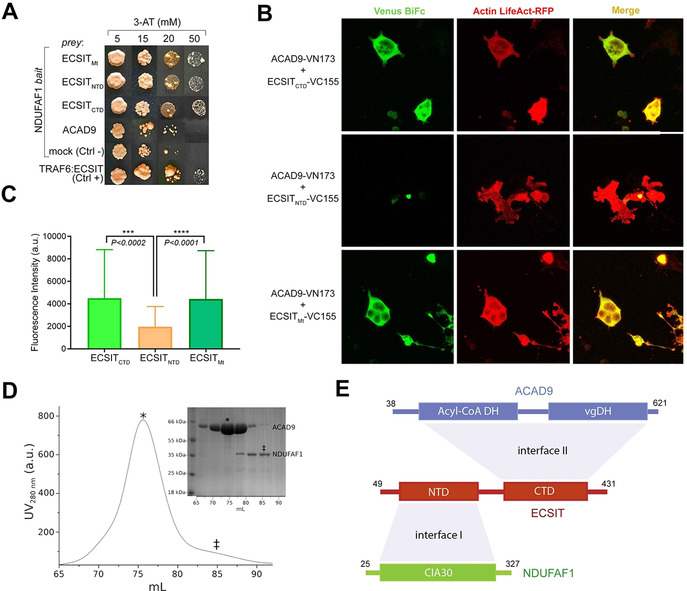
Figure 1.

Identification of protein–protein interactions within the MCIA core complex. A) Y2H assays (NDUFAF1 as bait, different ECSIT and ACAD9 constructs as prey) indicate direct interactions between NDUFAF1 and mitochondrial (Mt, residues 49–431), N‐terminal domain (NTD, residues 49–252) or C‐terminal domain (CTD, residues 246–431) ECSIT constructs. No interaction is detected between NDUFAF1 and ACAD9. ECSIT and TRAF6 interaction was used as a positive control. B) BiFC assays in HEK293 human cells. Active reassembly of Venus (green signal) indicates that mitochondrial ECSIT (VC155‐ECSITMt) and the ECSIT C‐terminal domain (VC155‐ECSITCTD) interact with ACAD9 (ACAD9‐VN173). Red immunofluorescence from filamentous actin (LifeAct‐RFP) was used as a cell marker. Overlapping signals (yellow) confirm cells with positive interacting partners. C) Quantification of the signal using the FITC (green spectrum) or CY3.5 (red spectrum) filter settings. D) SEC chromatogram showing that ACAD9 (*) elutes as single peak separated from NDUFAF1 (≠), which suggests the absence of interaction between ACAD9 and NDUFAF1, as observed in Y2H assays. E) Domain interaction organization of MCIA complex proteins. ECSIT‐interacting interface regions with NDUFAF1 (I) and ACAD9 (II) respectively are shown in light grey. DH: dehydrogenase domain; vgDH: vestigial DH domain; CIA30: Complex I intermediate‐associated protein 30 domain.
