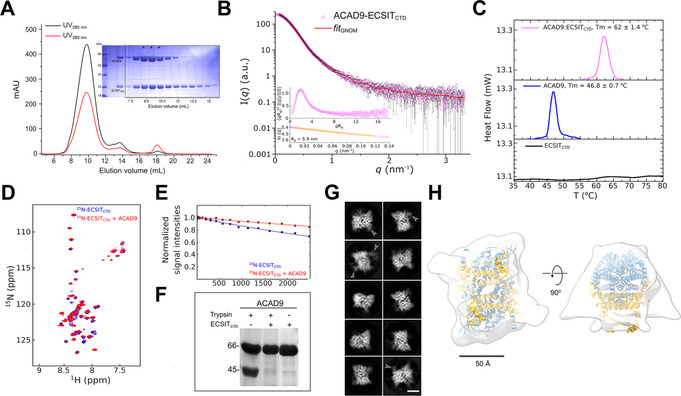
Figure 2.

ECSITCTD forms a stable complex with ACAD9. A) SEC elution profile of the complex and loaded onto an SDS‐PAGE (*), showing a small adjacent peak of unbound ECSITCTD. B) SAXS scattering curve for the complex, with the GNOM fitting curve in red. Inset: normalized Kratky plot and close‐up of the Guinier region used to estimate the radius of gyration (Rg in nm) of the complex. C) Thermal denaturation profiles of ECSITCTD, ACAD9 and their complex determined by differential scanning calorimetry. Estimated T m values are indicated. A clear unfolding transition was not detected for ECSITCTD. D) 2D‐NMR interaction experiments of 15N‐labelled ECSITCTD and unlabelled ACAD9. Superimposed 1H‐15N correlation spectra of free ECSITCTD and ECSITCTD in complex with ACAD9 are shown in blue and red, respectively, in the region 8.5–7.5 1H ppm in the proton dimension. This highlights chemical shift perturbations in 11 out of 60 detected peaks in the amide region, indicating that ACAD9 interacts specifically with a few residues of ECSITCTD. E) 15N‐filtered DOSY‐NMR measurements on 15N‐ECSITCTD and ACAD9‐15N‐ECSITCTD complex. The exponential decay curves of ECSITCTD, in the absence and in the presence of ACAD9 are shown in blue and red, respectively. The units on the y‐axis are normalized values of the integrals of the signal measured in the amide proton region. The slower translational diffusion coefficient of ECSITCTD measured in the presence of ACAD9 is also consistent with ECSITCTD being part of an object larger than a single dimer (i.e. >40 kDa in size). F) Enhanced trypsin resistance of ACAD9 in the presence of ECSITCTD. ACAD9 subjected to trypsin digestion in the absence of ECSITCTD shows a 45 kDa proteolytic fragment. In contrast, ACAD9 is protected from proteolysis in the presence of ECSITCTD, further confirming the formation of a stable complex between ACAD9 and ECSITCTD. All proteolytic fragments are resolved by SDS‐PAGE. G) Selected cryo‐EM 2D class averages of the ACAD9‐ECSITCTD complex reveal a compact rectangular core with visible secondary structural features. Diffuse densities at defined locations on the ACAD9 core are indicated with arrowheads. Scale bar=50 Å. H) Top and side views of the 15 Å resolution cryo‐EM envelope of the ACAD9‐ECSITCTD complex displayed at low thresholds. The VLCAD‐based homology model of ACAD9 is fitted in the density, with dehydrogenase domains and the C‐terminal linker and vestigial domains shown in blue and gold, respectively. Scale bar=50 Å.
