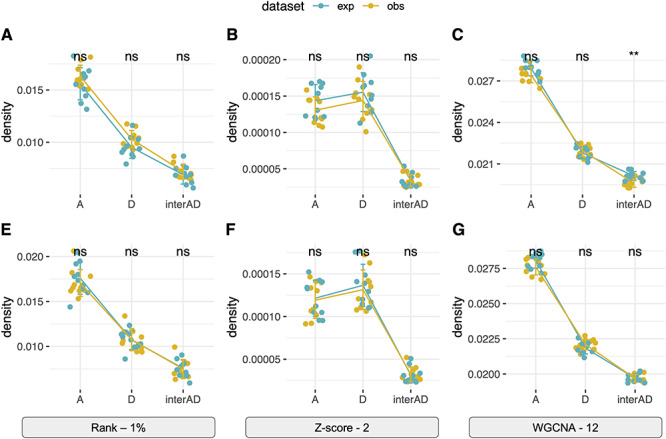
Figure 6.

Different inferences of subnetwork topology. The network density of A-subnetwork and D-subnetwork and interconnections between A- and D-subnetworks were shown for both the expected and observed data from the GSNAP-PolyCat (A–C) and EAGLE-RC (E–G) estimation with log2RPKM normalization. (A and E) Rank-based binary network with top 1% connections; (B and F)Z-statistics binary network with connections above Z-score of 2; (C and G) WGCNA network with the power of 12.
