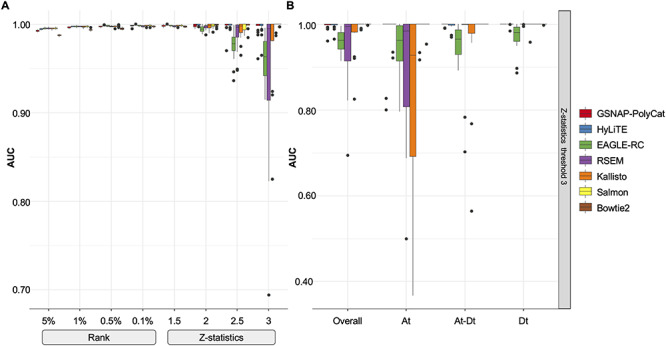
Figure 5.

Performance of binary co-expression network construction. (A) Boxplot of AUC scores were shown using different homoeolog estimation pipelines (color) and binary thresholds (x-axis). (B) Taking the Z-score threshold of 3, for example, AUC scores were compared among subnetworks: Overall, all edges considered; At, edges within the A-genome subnetwork; Dt, edges within the D-genome subnetwork; At-Dt, edges connecting genes across A- and D-subnetworks.
