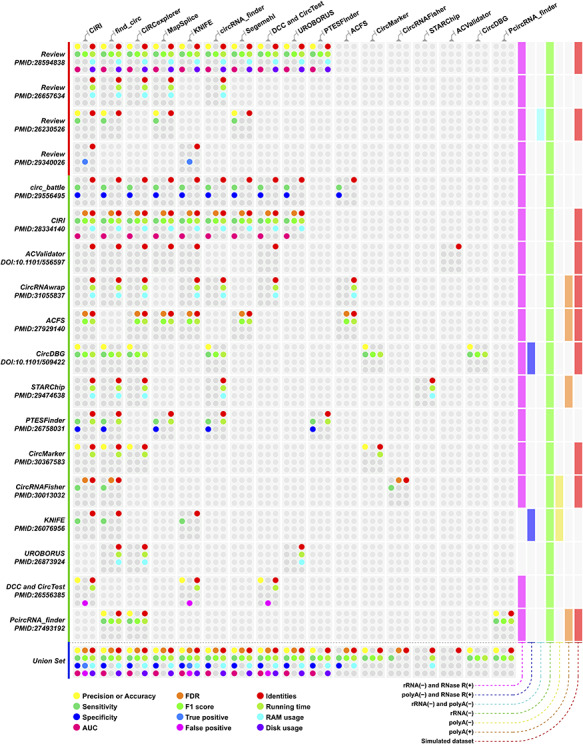
Figure 4.

Performance index of circRNA identification methods evaluated by different studies. The colored dot represents different performance indices, and the corresponding performance index for each dot is provided in the legend of the figure. Rows are different studies and classified by publication types, and the last row is the union set of each column. The columns represent circRNA identification tools, and the order is based on mentioned occurrences in those studies. Details regarding the dataset used in these studies are available in Supplementary Table 2.
