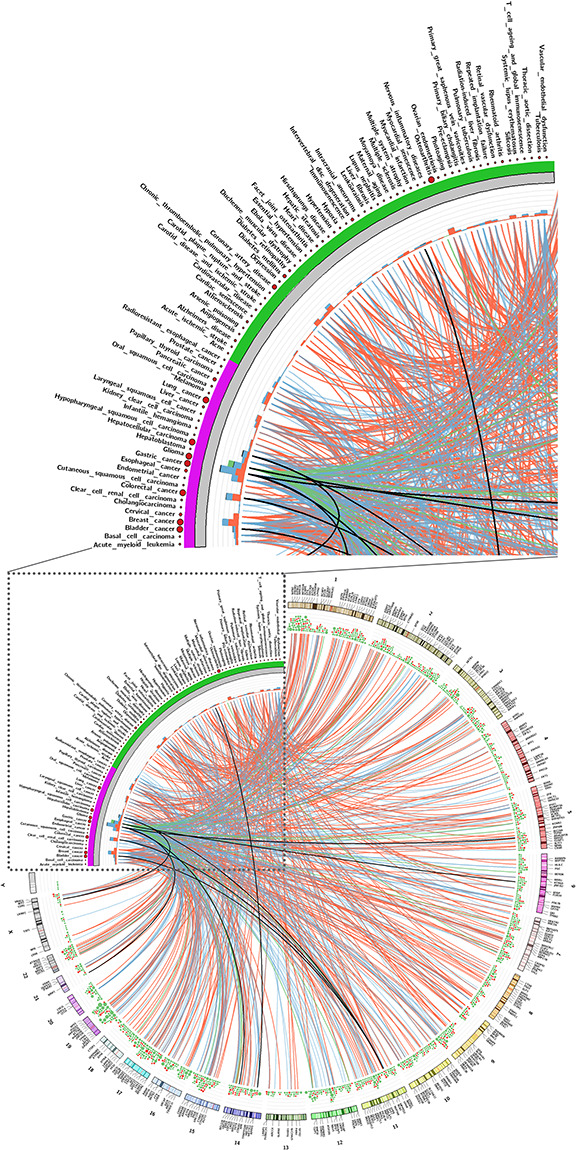
Figure 6.

CircRNA-disease association. The top figure is an enlargement of a corner of the bottom figure. Association with circRNAs and diseases, recorded in Circ2Disease, CircR2Disease and circRNADisease. All associations were manually curated from the literature. Purple marks are cancers and other diseases are in green. The circRNA host gene symbols and chromosome label are shown in the outer layer of the genome ideogram. The scatter plot represents the number of publications for each disease, and the stacked bar plot the number of circRNAs related with each disease, and the color represents the regulation direction. The links connect the diseases and circRNAs. The different regulation directions are marked by color: red indicates circRNA up-regulated in a disease, blue indicates down-regulated, green indicates unclear regulation direction, and black, circRNA that can be detected up and downregulated in different publications. In the gene density layer, red represents the disease-related circRNAs and green represents the functional circRNA records in the CircFunBase. A high-resolution figure (the gene symbol is visible) and the association details are available in Supplementary Figure 3 and Supplementary Table 3, respectively.
