
FIGURE 5.
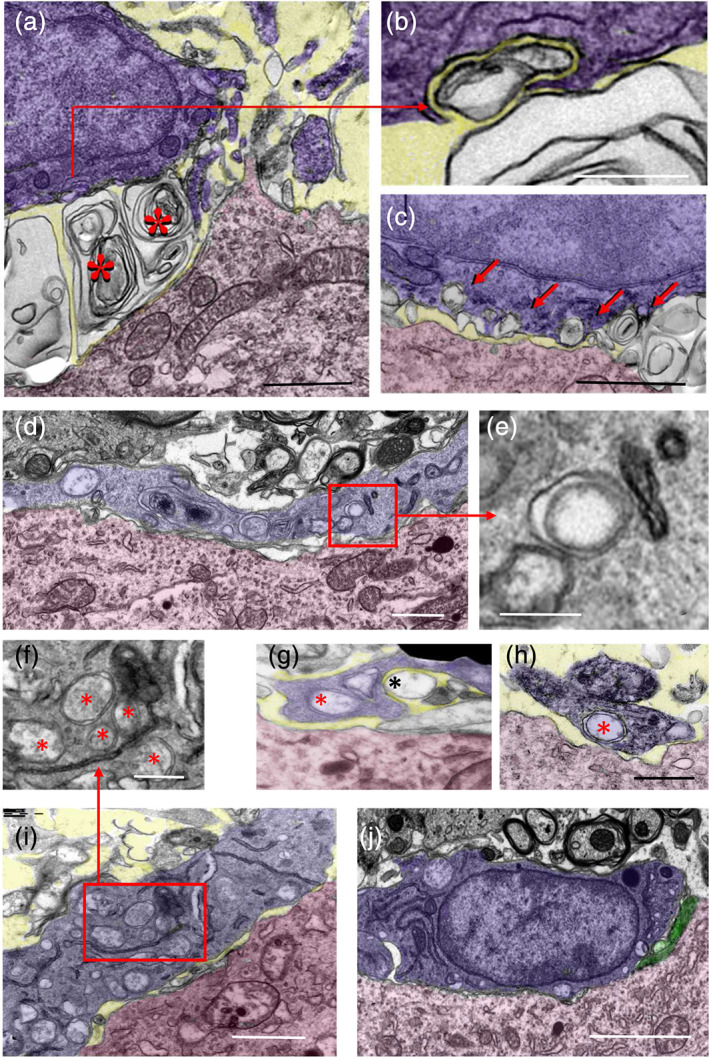
Ultrastructural analysis of the interactions of microglial cell bodies (shaded in blue) with motor neuron (MN) cell bodies (shaded in red) 7 days after axotomy. (a) Extracellular multilamellar bodies and vesicles (*) are seen interposed between an Iba1‐immunostained microglial cell and an axotomized MN cell body; note that extracellular membranous structures appear in sites that would normally be occupied by presynaptic boutons on an uninjured MN soma. This suggests that the extracellular material came from disrupted synaptic terminals. (b,c) Extracellular vesicles interact with microglial cell surfaces and undergo a process of enwrapping (b, [a high magnification detail of the indicated region in a]) and engulfment; in (c) there is a sequence of early contacts leading to a final engulfment (shown by the arrows). (d) A microglial cell profile (blue) covering the surface of an axotomized MN cell body (red), which appears to be completely denuded of synaptic terminals; note the presence of abundant double‐membrane endocytic/phagocytic inclusions inside the microglial cytoplasm (detailed in e). (g,h) An example of a microglial process (blue) close to an axotomized MN cell body (red); microglia interact with a single‐membrane‐bounded extracellular vesicle (black *) and contain a double‐membrane vesicular inclusion (red *), presumably resulting from extracellular vesicle endocytosis (g). The microglial nature of the processes containing a double‐membrane bounded inclusion (red *) is demonstrated by Iba1 ultrastructural immunolabeling (h). (i) A microglial cell process (blue) interacting with a surface of an axotomized MN cell body (red), which is depleted of afferent synaptic terminals; note the abundance of double membrane‐bounded inclusions (enlarged in (f)), presumably resulting from phagocytosis of EVs. (j) A microglial cell (blue) covering large areas of an axotomized MN surface (red) depleted of synaptic afferents (only a few of them remain, shaded in green); the microglial cell displays few phagocytic inclusions and a cytoplasmic organization suggestive of a less activated state. The extracellular space found in some panels is shaded in yellow. Scale bars: (a, c, d, and i = 1 μm; b) 250 nm; (e–h) = 500 nm; and (j) = 2.5 μm [Color figure can be viewed at wileyonlinelibrary.com]