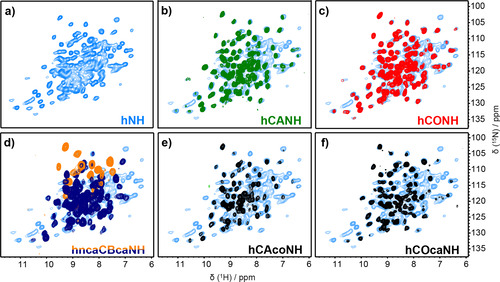
Figure 2.

2D and all planes from 3D spectra of uniformly 2H/13C/15N labelled NS5A‐AHD1. a) 2D hNH spectrum in light blue. b–f) Overlay of all signal‐containing NH planes along the carbon dimension of hCANH, hCONH, hCAcoNH, hCOcaNH and hncaCBcaNH 3D spectra, on the 2D hNH of panel (a) as background.
