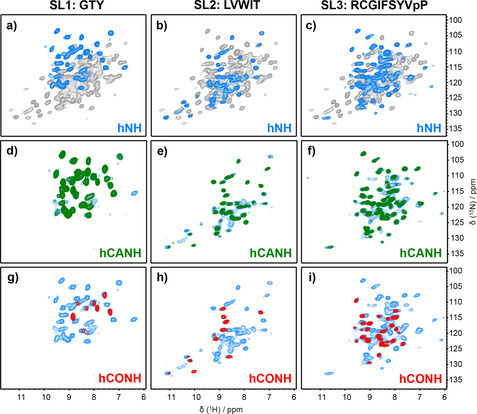
Figure 3.

2D and 3D spectra of selectively labelled NS5A‐AHD1 samples. a–c) Two‐dimensional hNH spectra of selectively labelled samples in blue are overlaid on the hNH spectra of uniformly labelled sample in gray. d–i) Overlay of all signal‐containing NH planes along the carbon dimension of hCANH (green) and hCONH (red) 3D spectra, on the 2D hNH spectra (blue).
