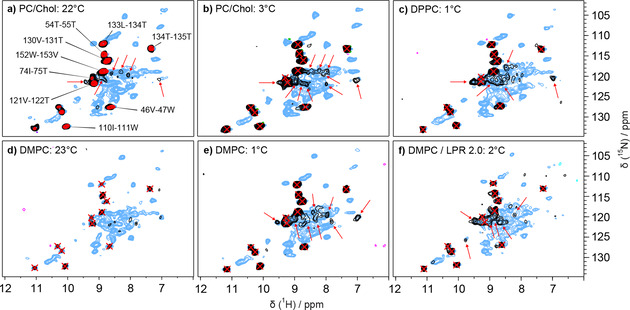
Figure 5.

Impact of lipid environment and temperature on NS5A‐AHD1. SL2 NS5A‐AHD1 protein was reconstituted into PC/Chol (a, b), DPPC (c) or DMPC (d–f) lipids at LPR 0.5 (a–e) or at LPR 2 (f). Spectra in PC/Chol are recorded above the lipid phase transition temperature (T m) (T m=−6 °C), while those in DPPC are recorded below (T m=41 °C). Spectra in DMPC are recorded around and below (T m=24 °C). 2D hcoNH (black) and hNH spectra (blue) were acquired at 60 kHz in 0.7 mm rotors at conditions close to room temperature (a, d) or close to 0 °C (b, c, e, f). All planes from hCONH 3D spectra (red) of a standard SL2 sample were overlaid on the 2D hcoNH and hNH in (a) used as reference. Red arrows in (a), (b) and (c) point out newly detected resonances in the hcoNH.
