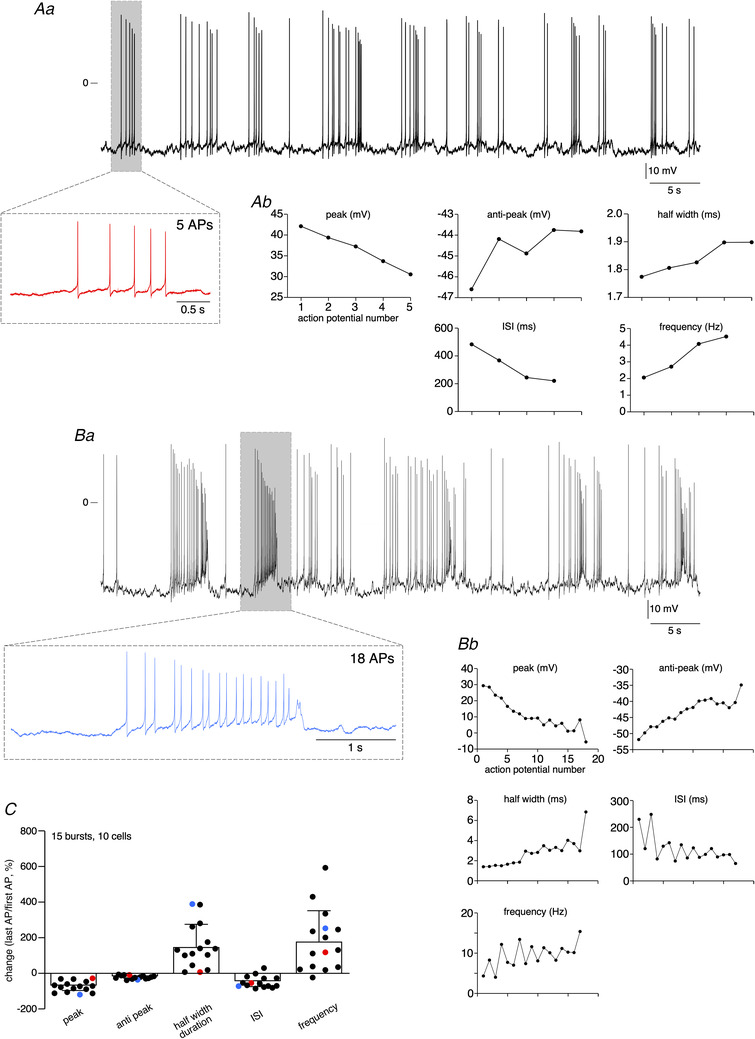
Figure 2. Analysis of AP parameters in bursts.

Evolution of AP peak amplitude, AHP (anti‐peak) amplitude, half‐width duration, interspike interval (ISI) and intra‐burst instantaneous firing frequency measured in consecutive spikes within a burst (Ab and Bb). Example of two mouse CCs, with an AP number in a burst <10 (Aa) and >10 (Ba). C, pooled data of changes between the first AP and the last AP in a burst (data collected from 15 bursts, 10 cells). AP parameters corresponding to the cell illustrated in Aa are plotted in red and those corresponding to the cell illustrated in Ba are plotted in blue.
