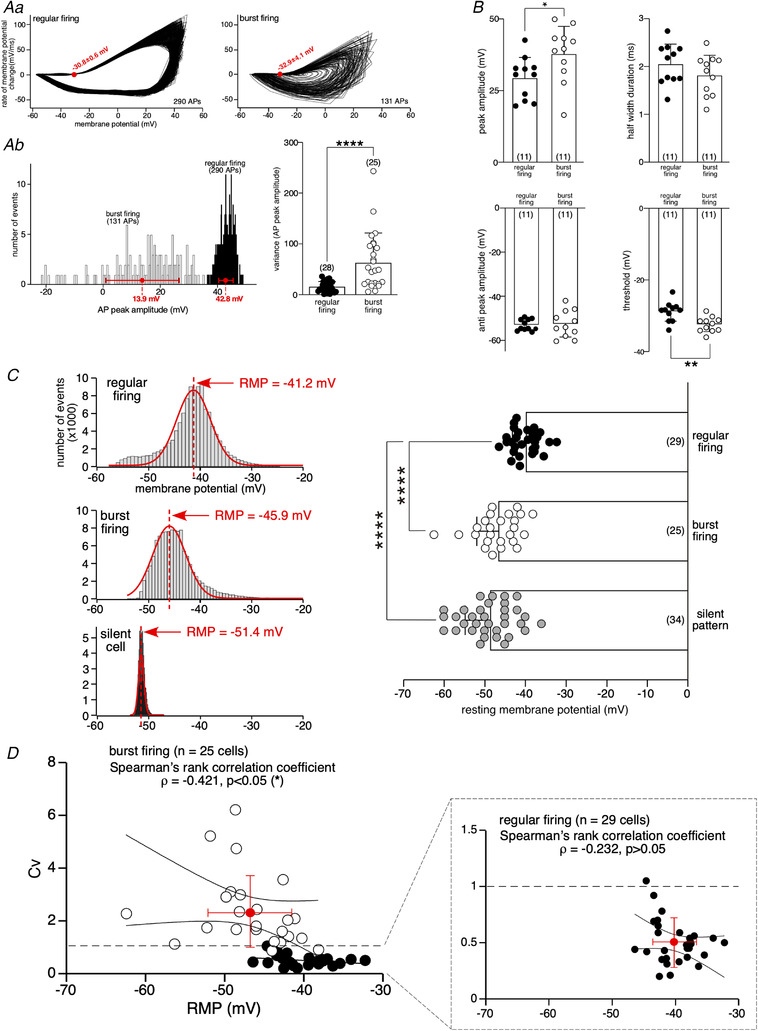
Figure 3. Analysis of action potential parameters in regular and bursting spiking cells.

Aa, phase‐plane plot analysis of APs of the two cells illustrated in Fig. 1. 299 APs were analysed in the regular cell and 131 in the bursting cell. The AP threshold (values plotted in red on the phase‐plane plots) is significantly more polarized in bursting cells (right histogram for pooled data, ** P < 0.01, unpaired t test. Ab, analysis of action potential peak amplitude showing a broader distribution in the bursting spiking cell (right histogram for pooled data, *** P < 0.001, unpaired t test). B, analysis of the first AP in a burst versus the first AP in a regular pattern. Significant differences were found for the peak amplitude (* P < 0.05, unpaired t test) and for the threshold (** P < 0.01, unpaired t test). Data were collected from 22 cells randomly selected (11 cells with a regular pattern and 11 cells with a bursting pattern. The AHP amplitude and the half‐width duration do not significantly differ between regular and bursting firing modes. C, determination of RMP from the sample (fraction of time) distribution of membrane potential values from the two cells recorded in Fig. 1 and from one silent cell. Pooled data (plotted in the right panel) show a significant difference in RMP between regular and bursting cells (**** P < 0.0001, one‐way ANOVA, Tukey's post hoc test), with a more polarized RMP in bursting CCs. Silent cells also displayed a significantly more polarized RMP compared to regular cells (**** P < 0.0001, one‐way ANOVA, Tukey's post hoc test). No difference in RMP was found between bursting and silent cells (P > 0.05, one‐way ANOVA, Tukey's post hoc test). D, graphs plotting the RMP value of 29 regular cells and 25 bursting cells over the corresponding Cv. The Cv threshold allowing to discriminate between regular cells and bursting cells was positioned at Cv = 1 (dashed lines). The Spearman's rank correlation coefficient ρ, combined with the confidence band at 95%, shows a significant correlation between RMP and Cv values for bursting cells (ρ = −0.421, P < 0.05, but not for regular cells (ρ = −0.232, P > 0.05). The data for regular cells are expanded into the inset.
