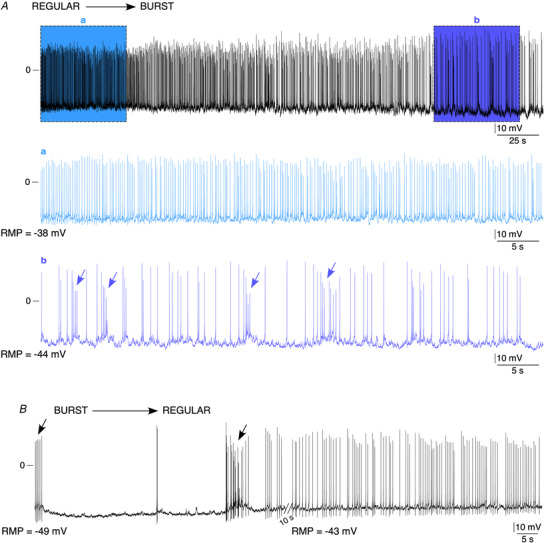
Figure 4. Dynamic switch between a regular and a bursting spiking pattern in a same CC.

A, example of a cell whose spontaneous electrical activity was recorded for 5 min and in which the spiking pattern switched from a regular to a bursting mode. Highlighted a and b sections: expanded time scale showing the regular mode at the beginning of the recording (section a) and the bursting mode at the end of the recording (section b). The arrows point to bursts. B, example of a cell recorded for two successive 1 min period (10 s interval between recordings), in which the bursting mode observed during the first 1 min recording switched to a regular mode during the second 1 min recording.
