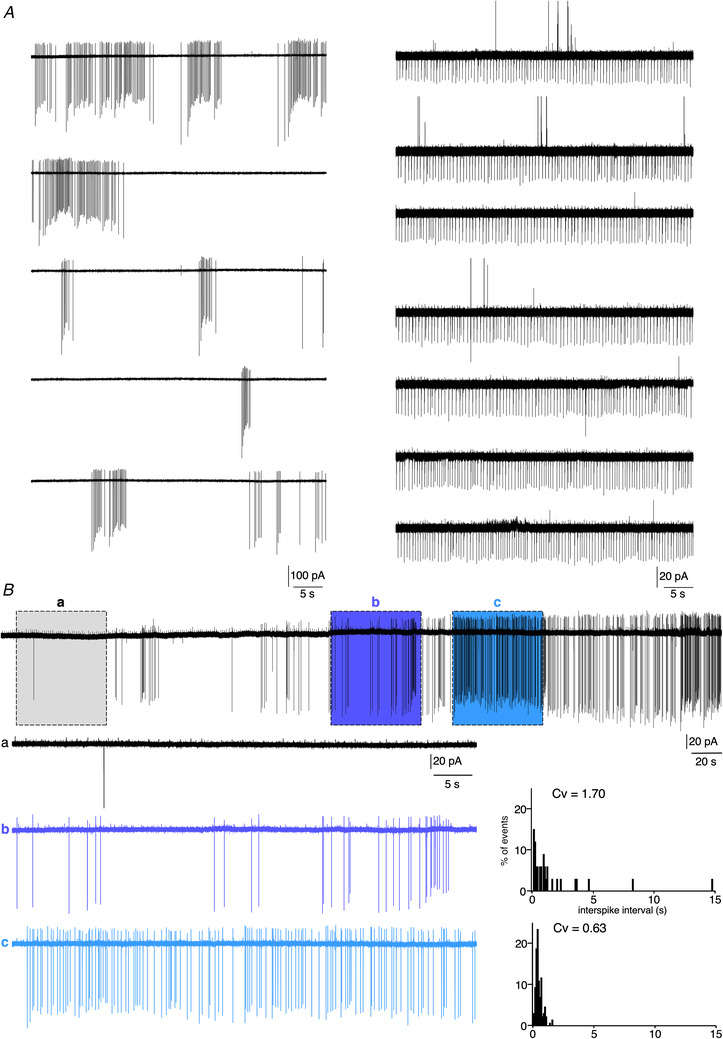
Figure 5. Loose‐patch recordings of a spontaneously firing mouse CCs.

A, spontaneous action potential currents recorded in two individual CCs. Left traces (5 successive 1 min recordings) illustrate an arrangement of the currents as bursts and right traces (7 successive 1 min recordings) exemplify a cell with a regular action potential current activity. B, chart recording (8 min duration) showing that a same cell can alternatively exhibit periods of regular (highlighted section c), irregular bursting (highlighted section b) and no firing (highlighted section a). The corresponding distributions of inter‐spike intervals and calculated Cv are plotted in the right histograms.
