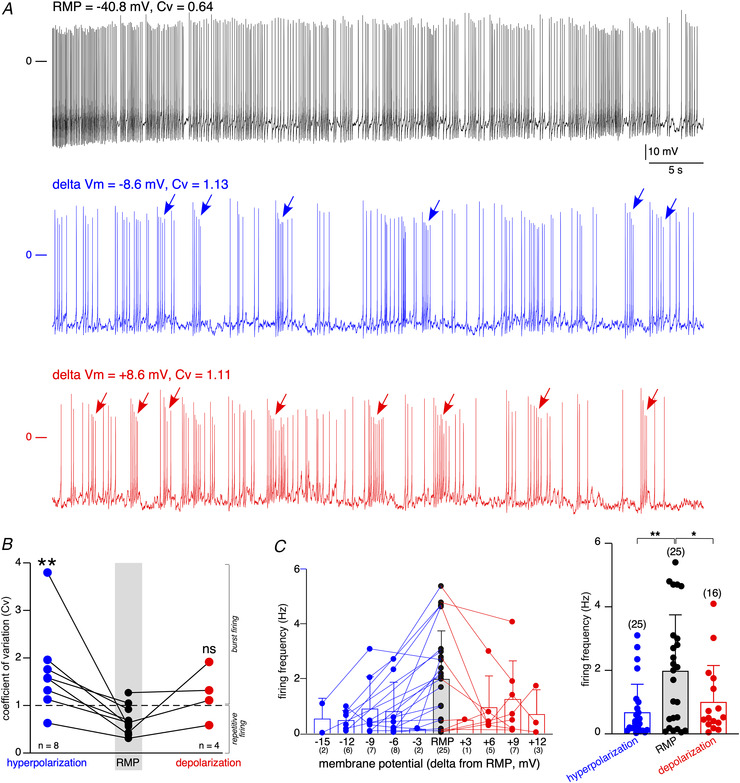
Figure 6. Membrane potential‐driven spiking pattern.

A, representative AP discharges recorded in one individual CC current‐clamped at RMP (black trace), hyperpolarized (blue trace, 8.6 mV as negative delta V m) or depolarized (red trace, 8.6 mV as positive delta V m). For each recording conditions, the Cv was calculated, given a value of 0.64 at RMP, 1.13 for hyperpolarized and 1.11 for depolarized conditions. Setting a threshold value of 1 for Cv to discriminate between regular (Cv < 1) and bursting (Cv > 1) cells, Cv values argue for a switch from a regular to a bursting mode. B, pooled data showing a significant increase in Cv in response to membrane hyperpolarization (** P = 0.0078, Wilcoxon matched‐pairs signed‐rank test), but not to membrane depolarization (P = 0.125, Wilcoxon matched‐pairs signed‐rank test). C, pooled data illustrating the firing frequency as a function of membrane potential (RMP and hyperpolarization/depolarization from RMP). The number of recorded cells is indicated below the value of membrane potential change. In panels B and C, the grey region of interest underlies the results obtained at RMP. [Color figure can be viewed at wileyonlinelibrary.com]
