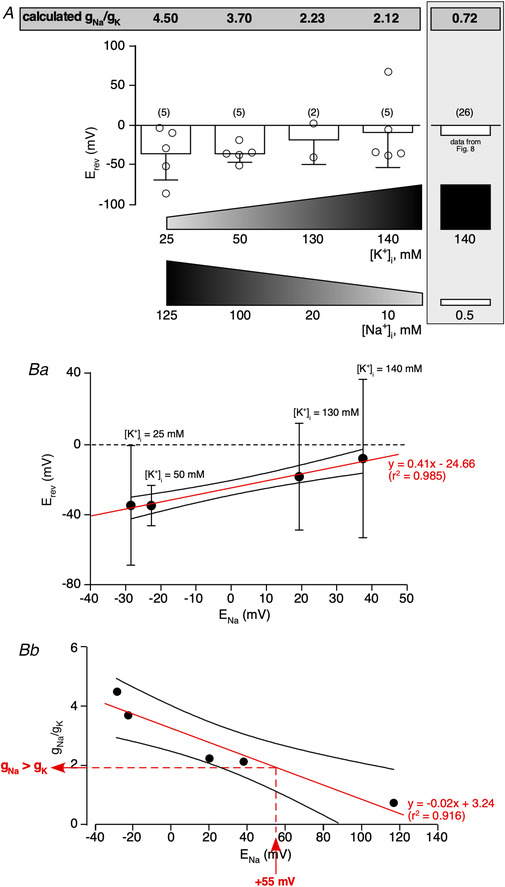
Figure 13. I Nab is more permeant to Na+ than to K+ .

Ionic selectivity of I Nab was assessed by changing intracellular K+ and Na+ concentrations (K+ concentrations 25, 50, 130 and 140 mM and Na+ concentrations 125, 100, 20, 10). The ionic concentrations highlighted in a grey filled rectangle correspond to the condition of a low (0.5 mM) intracellular Na+ concentration, which was used in experiments described in Fig. 6. Under each ionic condition, I Nab was recorded through a voltage ramp command (−110 to −50 mV, 3 s duration). A, the E rev value of I Nab was calculated, for each recording condition, from a linear extrapolation applied to the subtracted currents. g Na/g K ratios were then calculated as described in Methods. B, robust correlation of E rev over E Na (plotted with the confidence band at 95%), with the restriction of [Na+]I ≥ 10 mM (Ba) and of g Na/g K over E Na (also plotted with the confidence band at 95%, Bb). Data were fitted with a linear regression (r 2 = 0.985 and 0.916, respectively). Note that under physiological conditions (i.e. E Na = +55 mV), g Na/g K is close to 2, indicating that I Nab is about twice as permeant to Na+ as to K+. [Color figure can be viewed at wileyonlinelibrary.com]
