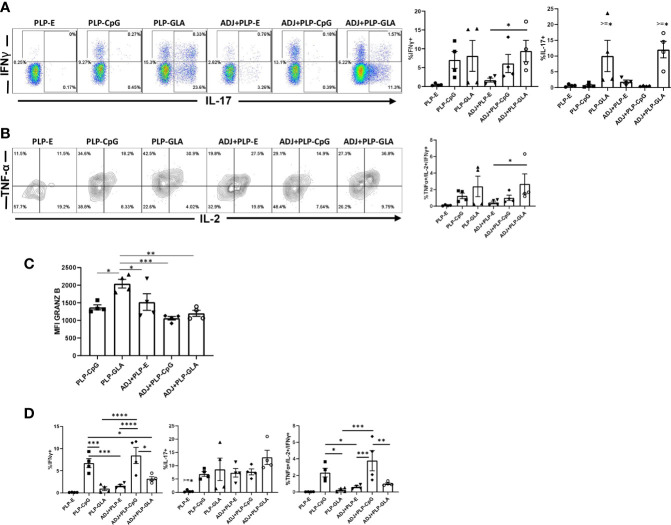
Figure 4.
Functional polarization of effector CD8 and CD4 T cells in vaccinated mice. Mice were vaccinated as described in Figure 2 . On the 8th day after booster vaccination, lung cells were stimulated ex vivo with NP366 or NP311 peptides for 5 h. The percentages of NP366 peptide-stimulated CD8 T cells or NP311 peptide-stimulated CD4 T cells that produced IFN-γ, IL-17, TNF-α, and IL-2 were quantified by intracellular cytokine staining. (A) FACS plots and graphs show the percentages of cytokine-producing cells among the gated CD8 T cells. (B) Data in graphs are percentages among gated IFN-γ-producing CD8 T cells. (C) Graphs show the percentages of cytokine-producing cells among CD4 T cells or IFN-γ-producing CD4 T cells (TNF+IL-2+). (D) Cells were stained with anti-CD8, Db/NP366 tetramers and anti-granzyme B antibodies directly ex vivo. Graph shows MFI for granzyme B staining in NP366-specific CD8 T cells. Data are representative of three independent experiments. *, **, ***, and **** indicate significance at P < 0.1, 0.01, 0.001, and 0.0001, respectively.

