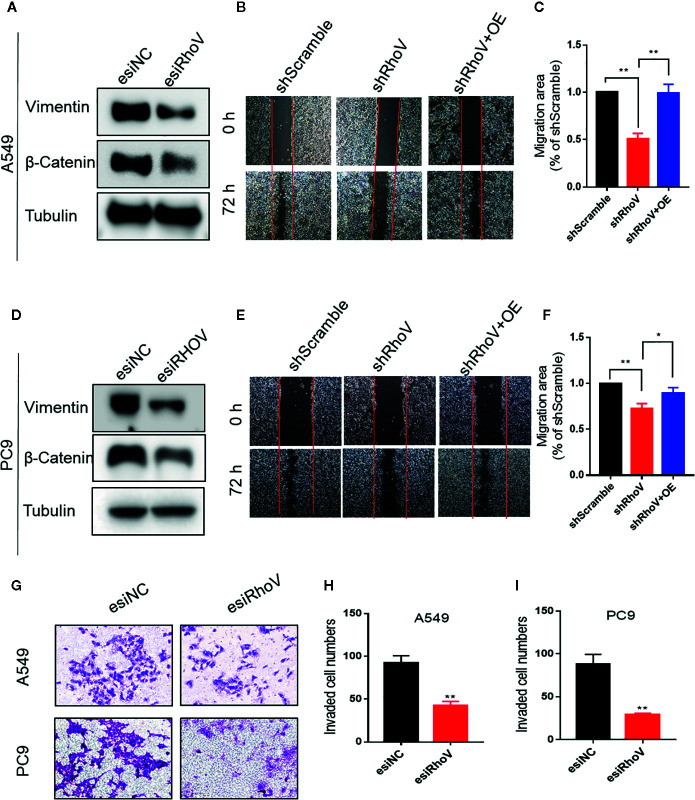
Figure 3.
Knockdown RhoV suppressed A549 and PC9 cell migration and invasion. (A, D) Western blot analysis of Vimentin and β-Catenin expression after transfection esiRhoV for 48 h. Representative images of the scratch assay in A549 (B, C) and PC9 (E, F) cells and relative migration areas were measuring for statistics. (G–I) Representative images of transwell invasion assay in A549 and PC9 cells and the number of invaded cells were measuring for statistics. (Compared with match control, *p < 0.05, **p < 0.01).

