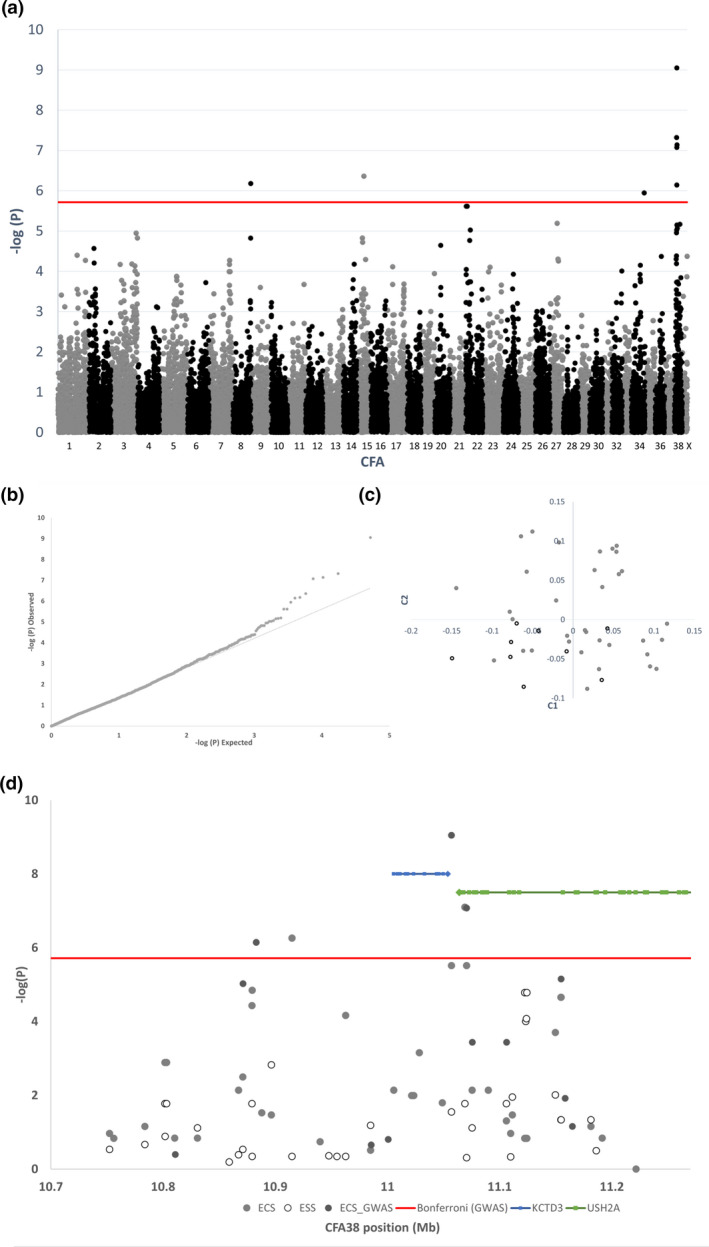
Figure 2.

(a) Negative log of probability of whole‐genome association of roan vs. non‐roan in the English Cocker Spaniel (nine non‐roan and 34 roan) (b) Q–Q plot of association. (c) Multidimensional scaling plot of first two components of variation in samples. (d) Negative log of probability of local association of roan vs. non‐roan in English Cocker Spaniels and ticked vs. clear in English Springer Spaniels.
