
FIGURE 3.
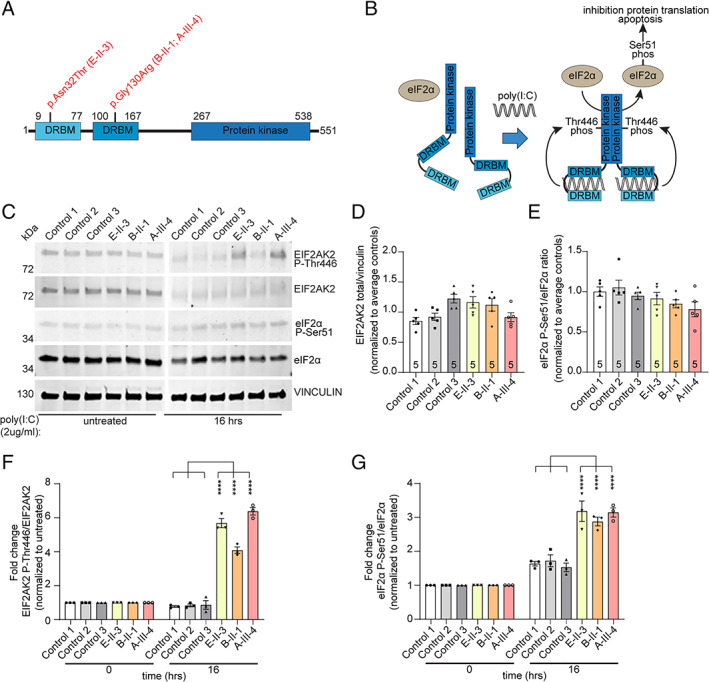
Expression studies. Dystonia‐associated EIF2AK2 variants lead to prolonged phosphorylation of EIF2AK2 Thr446 and downstream target eIF2α‐Ser51 in patient‐derived fibroblasts in response to polyinosinic acid:polycytidylic acid (poly[I:C]) exposure. (A) Schematic representation of the EIF2AK2 protein structure double‐stranded RNA binding motif (DRBM). Locations of the variants detected in the patients are indicated. (B) Schematic diagram showing the downstream effectors of the EIF2AK2 pathway after treatment with poly(I:C). (C) Representative Western blots of protein extracts from control (Control 1, 2, 3) and EIF2AK2 patient (E‐II‐3, B‐II‐1, A‐III‐4) fibroblast cell cultures that were either untreated or treated with poly(I:C) (2μg/ml) for 16 hours. Protein extracts were probed on the same blot for expression of phosphorylated EIF2AK2 (EIF2AK2 P‐Thr446), total EIF2AK2 protein levels (EIF2AK2), phosphorylated eIF2α (eIF2α P‐Ser51), and total eIF2α (eIF2α) protein levels. Vinculin was used as protein loading control. Molecular weights are indicated on the left (kDa). (D) Quantification of total EIF2AK2 levels in untreated cell cultures showing no significant changes between control and patient fibroblast cell cultures (n = 5). (E) Quantification of phosphorylated Ser51 eIF2α protein levels in untreated cell cultures, indicating no changes in EIF2AK2 variant carrying patient cells compared to unrelated control fibroblasts (n = 5). (F) Quantification of the fold change of phosphorylated EIF2AK2 Thr446 over total EIF2AK2 protein levels after poly(I:C) treatment (2μg/ml) for 16 hours normalized to untreated cells. (G) Quantification of the fold change of phosphorylated eIF2αSer51 over total eIF2α protein levels after poly(I:C) treatment (2μg/ml) for 16 hours normalized to untreated cells. Two‐way analysis of variance with Tukey multiple comparisons between controls and subjects with EIF2AK2 variants were performed. Values represent mean ± standard error of the mean (n = 3 biological replicates; ****p < 0.0001). [Color figure can be viewed at www.annalsofneurology.org]