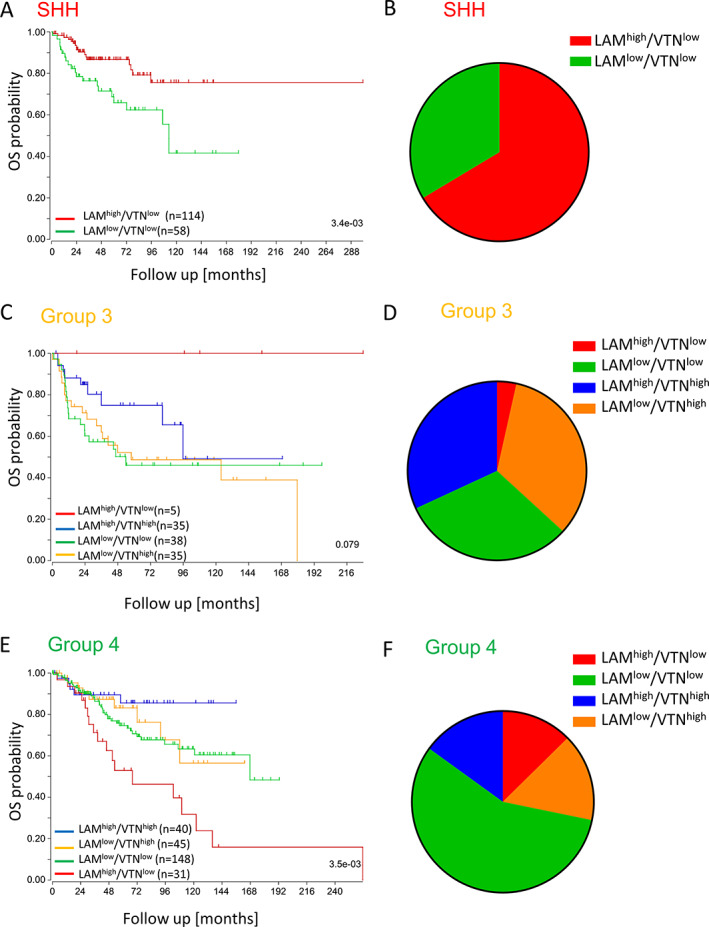
Figure 6.

ECM subgroups that are defined by the expression patterns of laminin‐111/211 and vitronectin (VTN) are clinically relevant and predict patient's overall survival (OS) in a subgroup‐specific manner. ECM subgroups have been assigned based on the expression level of LAMA1/LAMA2 and VTR for every SHH, Group 3, and Group 4 patient of the gene expression dataset from Cavalli et al [6] (groups with survival data: ‘LAMhigh/VTNlow’ n = 150; ‘LAMlow/VTNhigh’ n = 80; ‘LAMlow/VTNlow’ n = 244; ‘LAMhigh/VTNhigh’ n = 75). (A) In SHH MB, overall survival is good in the laminin group and significantly worse in patients with low expression of LAMA1/2 and vitronectin (n = 172, log‐rank test, p = 3.4e−03). (B) The laminin‐dominated ECM subgroup makes up the majority of SHH cases. (C) In Group 3, patients with high vitronectin have the worst overall survival (n = 113, log‐rank test, p = 0.079). (D) In contrast to SHH, in Group 3 MB the ‘LAMhigh/VTNlow’ group is very small, while the vitronectin‐containing groups and the LAMlow/VTNlow group account for similar patient's numbers. (E) In Group 4 MB, the worst overall survival is associated with high LAMA1/2 expression (n = 264, log‐rank test, p = 3.5e−03). (F) The largest ECM subtype of Group 4 MB shows low expression of both ECM markers.
