
Figure 3.
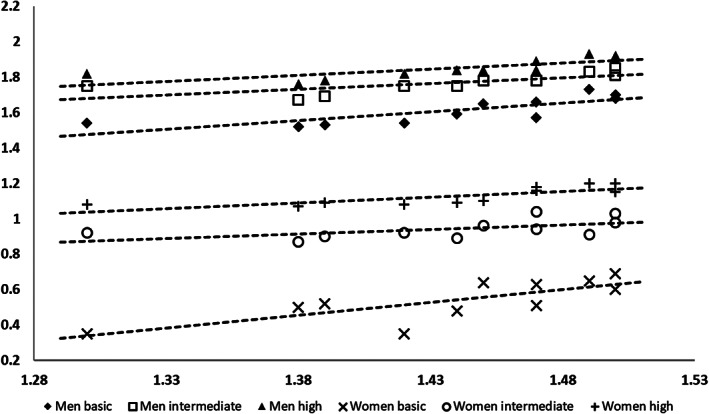
Age‐adjusted mean (logged) volume of alcohol consumption in six socioeconomic position groups aged 25–79 years (y‐axis), plotted against the overall (logged) mean alcohol consumption (x‐axis). Based on annual data 2004–2014.
Official websites use .gov
A
.gov website belongs to an official
government organization in the United States.
Secure .gov websites use HTTPS
A lock (
) or https:// means you've safely
connected to the .gov website. Share sensitive
information only on official, secure websites.
Age‐adjusted mean (logged) volume of alcohol consumption in six socioeconomic position groups aged 25–79 years (y‐axis), plotted against the overall (logged) mean alcohol consumption (x‐axis). Based on annual data 2004–2014.