
FIGURE 1.
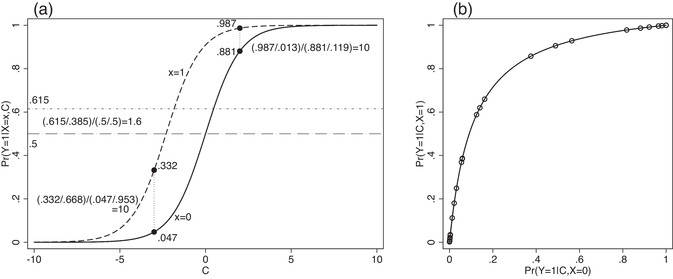
(a) A simple logistic regression model, and (b) the relationship between the conditional probability of given between the two treatment groups as implied by the model in (a). Thirty randomly chosen values of give rise to the superimposed scatter plot in (b)