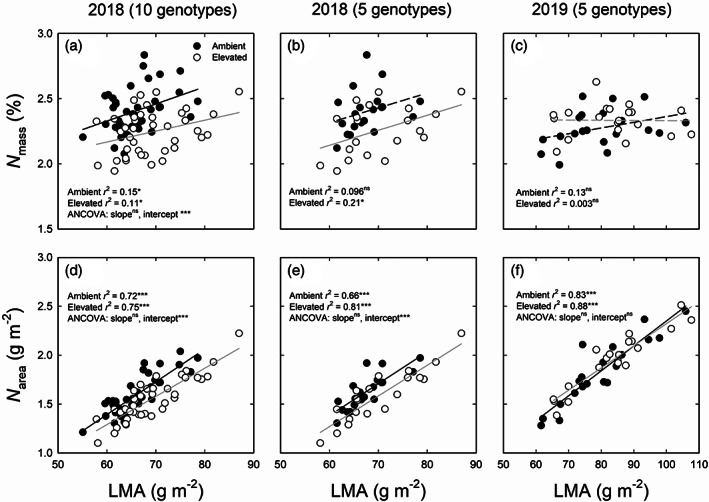
FIGURE 8.

The relationship between leaf dry mass per area (LMA) and leaf nitrogen content expressed on a mass basis (LMA and N mass, a–c), and on an area basis (LMA and N area, d–f) in 10 genotypes (a,d) and 5 genotypes (b,e) of sorghum grown under ambient and elevated O3 measured in 2018 and in 5 genotypes (c,f) of sorghum grown under ambient and elevated O3 measured in 2019. The data were fitted by linear regressions. Significant correlations are indicated by solid lines. ns, no significant difference (p > .05); *p < .05; ***p < .001
