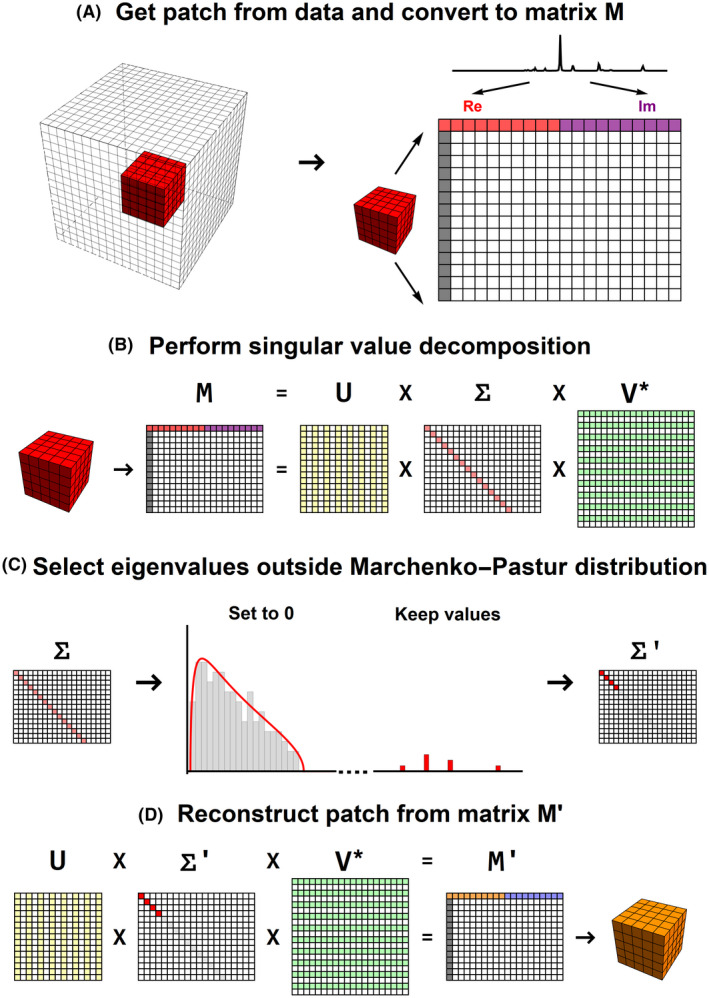
FIGURE 1.

Schematic representation of the PCA denoising algorithm. (A) Conversion of an image patch to a signal matrix M. (B) SVD of the signal matrix M. (C) Finding the eigenvalues that lie within the Marchenco‐Pastur distribution and set those to 0. (D) Reconstruction of the image patch using the denoised signal matrix M′. PCA, principal component analysis; SVD, singular value decomposition
