
FIGURE 5.
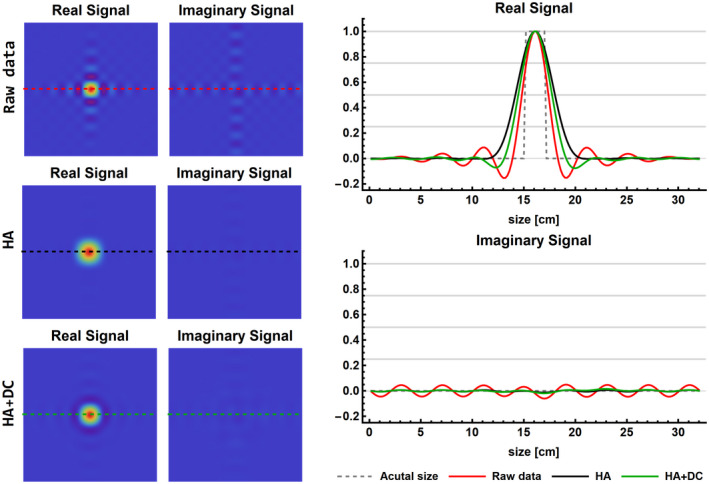
Results of the single voxel simulation to illustrate the effects of processing on the FWHM of the PSF and the Gibbs ringing. The signals are shown as a cross‐section through the voxel of the 3D CSI data at the spectral location of the PCr peak. The real and imaginary signals of the Raw, HA, and HA+DC data are shown in 2D (left column) and 1D (right column). DC, deconvolution; HA, Hamming filter