
FIGURE 6.
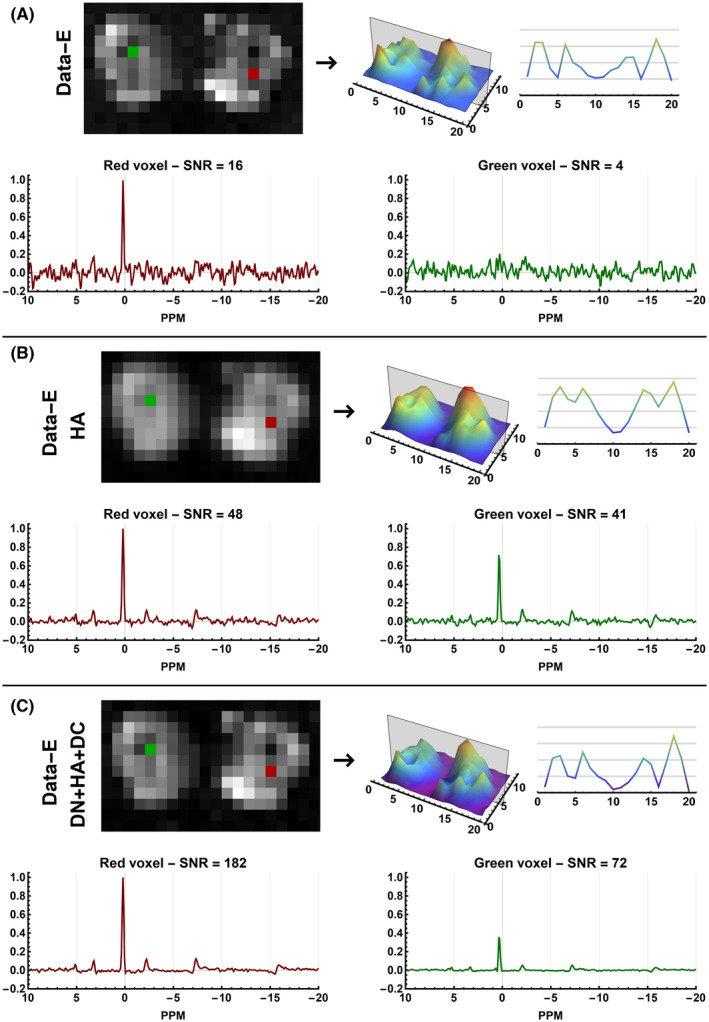
Results of the evaluated processing pipelines on the equal (Data‐E) weighted in vivo CSI data of the upper legs using Roemer coil combination. Each subfigure shows magnitude images of the mean spectral signal and the signal profile of the center slice of the acquired data. Below, it shows two example spectra all scaled relative to the same maximum amplitude. In red a spectrum is shown of muscle data that should contain maximal signal and in green a voxel located in the bone, which should show little to no signal. The reported SNR values are those of the PCr peak