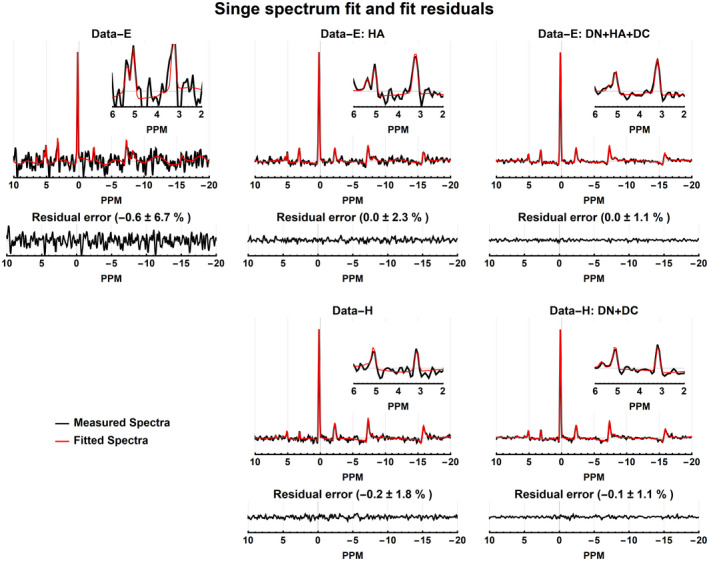
FIGURE 7.

Fits of a single voxel (red voxel of Figure 6) spectrum before and after processing. The panels show the real measured and fitted spectra, and real residual errors. The mean and SD of the residual errors are reported in the percentage of the PCr amplitude
