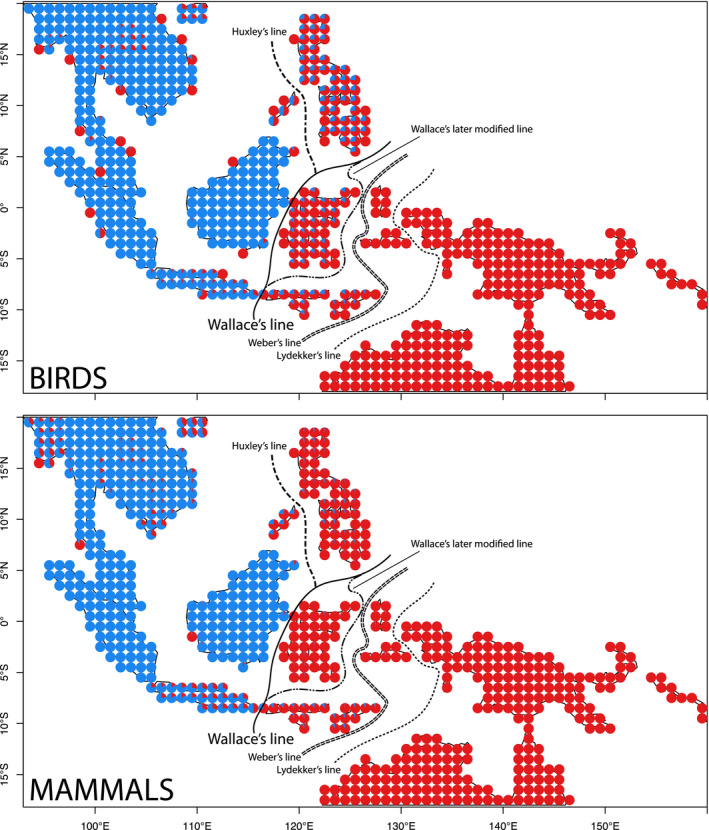
FIGURE 1.

Species motifs for birds and mammals in the Indo‐Pacific, K = 2. Each pie chart is coloured according to contributions to the location from the two regional biotas. Birds and mammals were analysed separately (colours represent unique groups in each map). Wallace’s original line is shown along with Huxley’s modification and Wallace’s own later modification. Weber’s and Lydekker’s lines are shown south‐east of Wallace’s Line. Lines are redrawn from van Welzen et al. (2011)
