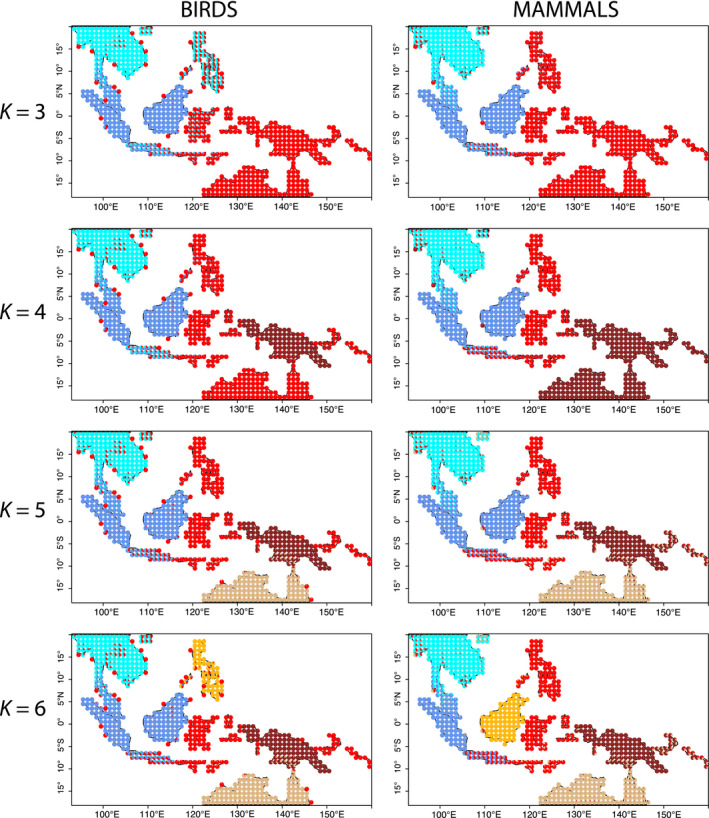
FIGURE 2.

Species motifs for birds and mammals in the Indo‐Pacific, K = 3…6. Each pie chart is coloured according to contributions to the location from the inferred biotas. Birds and mammals were analysed separately (colours represent unique groups in each map). Maps for K = 7…10 can be found in Supporting Information Figures S2, S3
