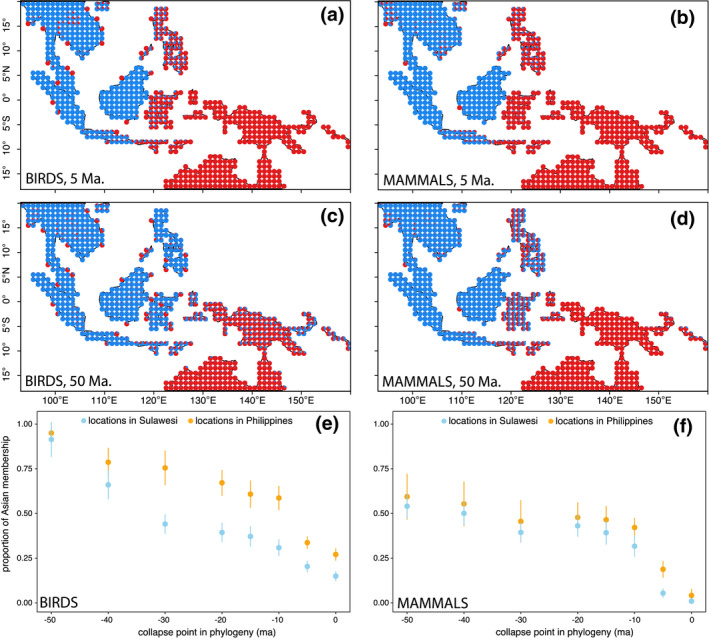
FIGURE 3.

Phylogenetic motifs for birds (left column) and mammals (right), K = 2. Each pie is coloured according to the contributions of the regional biotas after accounting for relationships at different time points in the phylogeny. (a,b) Motifs generated by subtending the tips of the phylogeny at 5 Ma. (c,d) Motifs generated by subtending the tips of the phylogeny at 50 Ma. (e,f) Mean ± SD for the average composition of the map cells in the Philippines and Sulawesi at different time points (additional maps showing time points are in Supporting Information Figure S4)
