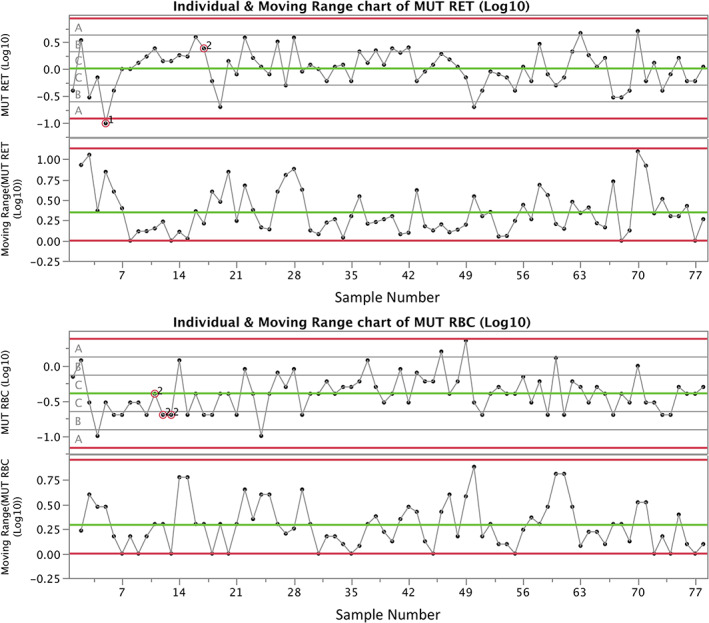
FIGURE 2.

Mutant reticulocyte (MUT RET) and mutant erythrocyte (MUT RBC) frequencies are graphed for the same vehicle‐exposed male and female rats portrayed in Figure 1 (i.e., 78 individuals). In this case, the results are plotted on control charts according to the order that analyses occurred (13 studies over 14 months). Zones A, B, and C signify values that are within 3, 2, and 1 SD from the mean, respectively. Nelson rules violations (numbered 1–8) are superimposed on data points when alerts are triggered. In the current example, “1” indicates a value is greater than 3 SDs from the mean, while “2” signifies that nine or more points in a row are on the same side of the mean. Overall, the low number of violations gives one confidence that the mutant cell scoring process is “under control.” While these charts were produced using the JMP software (v12.0.1), other packages such as Minitab can produce similar charts, as can packages in the R statistical programming language
