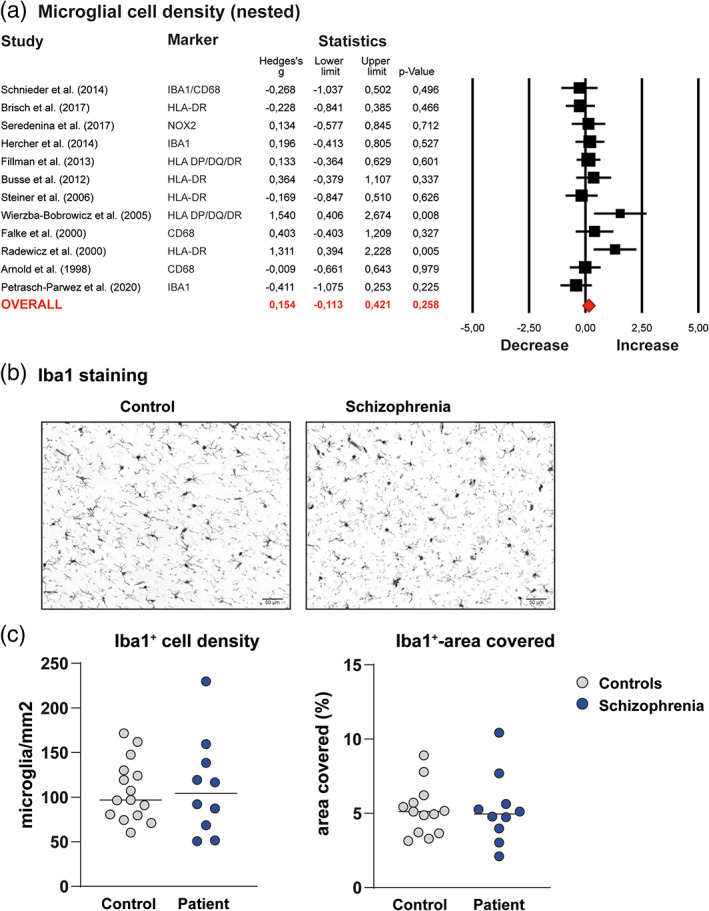
FIGURE 1.

Meta‐analysis microglial cell density and newly generated microglial cell density data in the temporal cortex of patients with schizophrenia and controls from the Netherlands Brain Bank (NBB) and Edinburgh Brain Bank (EBB). (a) Forest plot of primary meta‐analysis of studies assessing microglial cell density in schizophrenia (SCZ) postmortem brain tissue. Data from different regions in one study were nested to prevent overrepresentation. The forest plots in both graphs show the data included in a random effects meta‐analysis, representing effect sizes (Hedges's g′) with 95 confidence interval (CI) for differences between patients with SCZ and controls in each study. The Square size is proportional to study weight. Diamonds at the bottom of the graphs reflect the pooled effect sizes. (b) Representative pictures of the microglial staining of the temporal cortex of patients with schizophrenia (SCZ) and controls using immunohistochemistry with antibodies to ionized calcium‐binding adaptor molecule (Iba1). (c) The density of microglia (microglia/mm2) and percentage of the area covered with Iba1+ staining were quantified automatically using imageJ. Grey dots represent the controls (N = 16), blue dots the patients (N = 12), horizontal lines the median expression [Color figure can be viewed at wileyonlinelibrary.com]
