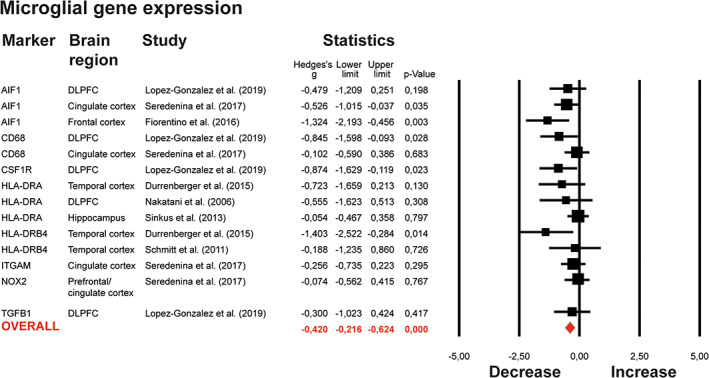
FIGURE 2.

Meta‐analysis on expression of microglial genes. Forest plot of primary meta‐analysis on expression of microglial genes. Studies are ordered by the microglial gene that was studied. The column “Brain region” refers to the brain region studied (DLPFC‐Dorsolateral Prefrontal Cortex; ACC‐Anterior Cingulate Cortex; mACC‐mid‐Anterior Cingulate Cortex). Data from different regions in one study were nested to prevent overrepresentation. The forest plots in both graphs show the data included in a random effects meta‐analysis, representing effect sizes (Hedges's g′) with 95 confidence interval (CI) for differences between patients with SCZ and controls in each study. The Square size is proportional to study weight. Diamonds at the bottom of the graphs reflect the pooled effect sizes [Color figure can be viewed at wileyonlinelibrary.com]
