

Abstract
A single model system for integrative studies on multiple facets of antigen presentation is lacking. PAKC is a novel panel of ten cell lines knocked out for individual components of the HLA class I antigen presentation pathway. PAKC will accelerate HLA‐I research in the fields of oncology, infectiology, and autoimmunity.
Keywords: APM, antigen presentation, HLA class I, CRISPR/Cas9, MHC
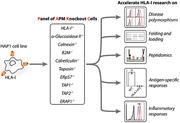
HLA class I (HLA‐I) proteins are crucial for the onset of CD8+ T‐cell responses during infections, cancer, or autoimmunity [1, 2, 3]. The understanding of HLA‐I antigen processing and presentation is more relevant than ever due to commonly occurring HLA‐I‐mediated resistance after cancer immunotherapy [4]. Current knowledge of antigen presentation is based on research in various cell types with distinct proteomes, antigen presentation machinery (APM) expression patterns, and HLA‐I haplotypes, which complicates the establishment of individual APM contributions to antigen generation, selection, and presentation. A model system capable of overcoming this issue is essential to allow for new discoveries in these processes. Therefore, we created a novel panel of HLA‐I APM KO cell lines, designated panel of APM knockout cells (PAKC), on the background of human HAP1 cells. These cells have a common HLA‐I haplotype (A*02:01, B*40:01, C*03:04), a functional HLA‐I antigen presentation pathway, an excellent cloning capacity, and a high proliferation rate. Furthermore, the haploid nature of HAP1 cells allows for powerful genome‐wide insertional mutagenesis screening to further unravel antigen presentation biology [5]. Using CRISPR/Cas9, we knocked out ten individual APM components; HLA‐I heavy chain, calnexin (CNX), alpha‐glucosidase II (GIIα), beta‐2 microglobulin (B2M), calreticulin (CALR), tapasin, ERp57, transporter associated with antigen processing 1 (TAP1), TAP2, and ERAP1 (Fig. 1A) [6]. ERAP2 and TABPBR were not targeted since RNA‐seq data indicated that these are not expressed in HAP1 cells [7]. For HLA‐I, a single gRNA recognizing a conserved sequence in the HLA‐A, ‐B, and ‐C (and ‐G, but not ‐E and ‐F) genes was used.
Figure 1.
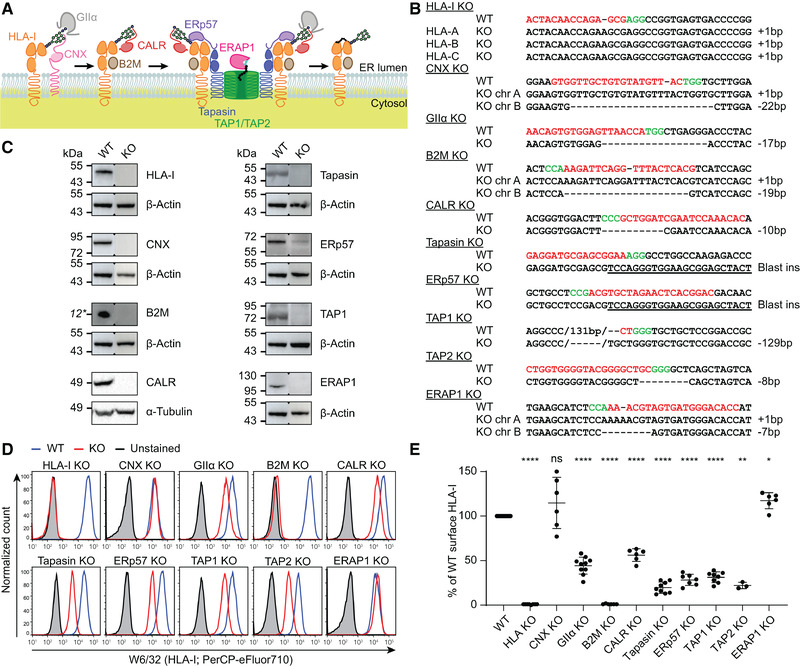
PAKC was validated on sequence and protein level. (A) Overview of the HLA‐I antigen presentation pathway. (B) CRISPR/Cas9 induced sequence mutations (dashes) in APM genes (underlined) in respective HAP1 clones. Tapasin and ERp57 KO clones were generated by genomic insertion of a blasticidin‐resistance gene (underlined). Chr, chromosome; gRNA, red; PAM sequence, green. This summary is representative of n = 1 (HLA‐I, CNX, B2M, CALR, ERp57, TAP1, and ERAP1) or n = 2 (GIIα, tapasin, and TAP2) independent experiments. Raw data in Supporting Information Fig. S1. (C) Immunoblots of KO cell lines for indicated proteins with β‐actin or α‐tubulin as loading control. Blots are representative of n = 1 (B2M and ERAP1) or n = 2 independent experiments. *Estimated band height. Raw data in Supporting Information Fig. S2. (D, and E) Flow cytometric analysis of surface HLA‐I expression (W6/32) in indicated KO cells. (D) Representative histograms. WT, blue; knockout, red; unstained control, gray. (E) Relative quantification pooled from n = 3–10 independent experiments per cell line. Mean ± SD are shown. Polyclonal cell lines and gating strategy in Supporting Information Figs. S3 and S4. Mixed‐effects analysis followed by Dunnett's multiple comparisons test, *p < 0.05, **p < 0.01, ****p < 0.0001, ns = not significant.
For efficiency reasons, we switched between genome‐editing strategies over time, from gRNA‐directed genomic insertion of a blasticidin‐resistance gene (tapasin, ERp57) to induction of random frameshift mutations (all other targets). Clonal cell lines were generated for all targets and targeted gene regions were sequenced (Fig. 1B and Supporting Information Fig. S1). Of note, the TAP1 KO clone had an in‐frame mutation inserting one and deleting 44 amino acids including the first transmembrane domain [8]. Immunoblot analysis of these cells showed a complete lack of TAP1 protein expression. Similarly, we validated the absence of HLA‐I heavy chain, CNX, B2M, CALR, tapasin, ERp57, and ERAP1 proteins in the respective KO cell lines (Fig. 1C and Supporting Information Fig. S2).
Subsequently, we characterized the impact of each targeted gene on HLA‐I surface expression by flow cytometry (Fig. 1D and E and Supporting Information Fig. S4). To control for gene editing and clonality biases, reintroduction of the deleted gene or polyclonal KO cell lines can be utilized. We confirmed that the HLA‐I phenotypes of the clones were representative using polyclonal KO populations (Supporting Information Figs. S3 and S4). Confirming observations by others, the KO cells of each APM component except ERAP1 and CNX showed a lower HLA‐I surface expression [3, 9, 10]. Interestingly, the different phenotype after KO of the partially redundant chaperones CNX and CALR warrants in‐depth studies into their mutual role in HLA‐I processing.
We then evaluated other opportunities PAKC provides to improve our understanding of HLA‐I antigen presentation. Several HLA‐I alleles and other APM polymorphisms are associated with susceptibility or resistance to infection, the development of cancer, and autoimmunity [1]. To demonstrate the feasibility of studying disease‐associated variations with PAKC, we detected expression of ten individually introduced HLA‐I alleles in wild‐type (WT) HAP1 cells using allele‐specific antibodies (Fig. 2A). Thus, PAKC can be employed to examine individual HLA‐I allele behavior in the context of disease‐related APM components.
Figure 2.
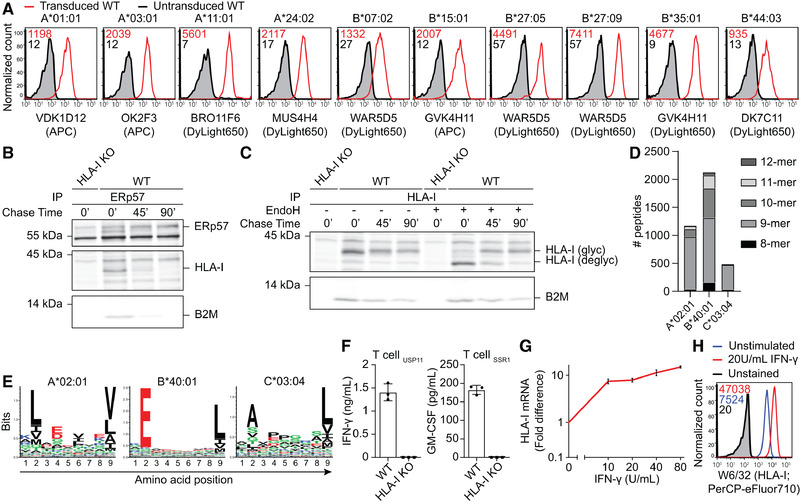
PAKC can be examined using common techniques in the antigen presentation field. (A) Flow cytometric analysis of WT HAP1 cells nontransduced (gray) or transduced (red) with depicted HLA‐A or ‐B alleles and stained using indicated allele‐specific antibodies. Gated on marker gene positive cells. Plots are representative of n = 2 independent experiments with one sample/experiment, HLA‐A*24:02, ‐B*35:01, and ‐B*44:03 of n = 1 and HLA‐B*27:05 of n = 3 independent experiments with one sample/experiment. Gating strategy in Supporting Information Fig. S4. (B, and C) Analysis of the HLA‐I maturation in IFN‐γ‐stimulated WT and HLA‐I KO HAP1 cells metabolically labeled with [35S]‐Met/Cys and chased for 0, 45, or 90 min. Experiments are representative of n = 2 independent experiments. (B) Co‐immunoprecipitation of HLA‐I using anti‐ERp57 antibodies was visualized using phospho‐imaging. (C) Co‐immunoprecipitation using W6/32 for HLA‐I followed or not by EndoH treatment. (D) Peptides eluted from HAP1 WT cells were identified by MS and assigned to an endogenous HLA‐I allele based on NetMHC4.0 predictions. n = 1 experiment. (E) Sequence signatures from unsupervised clustering of identified 9‐mer peptides by Seq2Logo. (F) IFN‐γ or GM‐CSF secretion by HLA‐A*02:01‐restricted T cells specific for USP11‐ or SSR1‐derived peptides after overnight co‐culture with WT or HLA‐I KO HAP1 cells was measured by ELISA. Results of technical triplicates cultures within one experiment are shown and are representative of n = 3 independent experiments. (G) Upregulation of HLA‐I mRNA (qPCR, normalized to 18S rRNA; n = 1 experiment) and (H) cell surface HLA‐I after IFN‐γ stimulation of WT HAP1 cells (flow cytometry; representative of n = 3 independent experiments with one sample/experiment). For qPCR, the error bars represent SEM of duplicate RNA isolations.
Next, we determined whether PAKC allows for evaluation of individual APM component contributions to HLA‐I folding, glycosylation, and peptide loading. In WT cells, ERp57 interacted only transiently with newly translated HLA‐I, indicating that HLA‐I peptide loading largely occurs within 45 min (Fig. 2B). The majority of HLA‐I matured within 90 min as detected by EndoH resistance of the HLA‐I N‐glycans (Fig. 2C). Such molecular studies will catalyze new mechanistic and disease‐related insights after overexpression of individual HLA‐I alleles or mutant APM members in their respective KO cells.
After two decades of development, HLA‐I peptide repertoire prediction algorithms still face major accuracy issues, possibly because the contribution of several APM members to peptide selection is unknown. Using WT cells, we explored the suitability of PAKC to study HLA‐I‐presented peptides. First, mass spectrometric analysis of eluted peptides identified 3774 candidate peptides derived from one of the endogenous HLA‐I alleles according to affinity predictions (Fig. 2D). Unsupervised sequence clusters generated from the 9‐mer peptides were in concordance with reported logos for HLA‐A*02:01, HLA‐B*40:01, and HLA‐C*03:04 (Fig. 2E) [11, 12, 13]. Second, individual peptide processing and presentation may be read out by targeted mass spectrometry, peptide/HLA‐I‐specific antibodies, or peptide‐specific T‐cell activation. We confirmed the latter option by specific recognition of WT cells using two independent T‐cell clones specific for endogenously derived HLA‐A*02:01‐restricted peptides (Fig. 2F). Both broad and targeted strategies will highly benefit from the comparable genetic and proteomic background of PAKC. Hence, PAKC will contribute to a better understanding of the rules of peptide processing and HLA‐I loading.
During infection, cancer, and autoimmunity, antigen presentation is locally enhanced by cytokines. Since IFN‐γ induces upregulation of HLA‐I mRNA and surface protein levels through an intact signaling pathway (Fig. 2E and F) [14], PAKC is highly suitable to study antigen presentation in an inflammatory context, for example in any of the above‐mentioned research directions. Additionally, PAKC supports studies on nonclassical HLA‐I, which can be expressed upon IFN‐γ stimulation.
In conclusion, we generated and validated a novel panel of APM component KO cell lines and demonstrated its application for many different research lines. PAKC will facilitate answers to open questions in the field, generation of new hypotheses, and revisitation of published data generated in imperfect or inconsistent model systems [15]. PAKC is now available for the scientific community to enable discovery of novel antigen presentation biology, which eventually may lead to new immunotherapeutic approaches.
Conflict of interest
The authors declare no financial or commercial conflict of interest.
Peer review
The peer review history for this article is available at https://publons.com/publon/10.1002/eji.202048599.
Abbreviations
- APM
antigen presentation machinery
- B2M
beta‐2 microglobulin
- CALR
calreticulin
- CNX
calnexin
- HLA‐I
HLA class I
- PAKC
panel of APM knockout cells
Supporting information
Supporting Information
Acknowledgements
We thank Dr. Schneider for qPCR, the Sanquin Research Facility for FACS, Dr. Springer and Dr. Hein (Jacobs University) for HLA‐B27 constructs, Dr. Griffioen (LUMC) for all other HLA‐I constructs, SSR1‐specific T cells, and critically reading the manuscript, Dr. Heemskerk (LUMC) for USP11‐specific T cells, Dr. Mezzadra (The Netherlands Cancer Institute) for the B2M CRISPR/Cas9 construct, and Dr. Neefjes (LUMC) for the HC10 antibodies. This work was supported by NWO (VENI 016.131.047 to R.M.S.), KWF Alpe d'HuZes (BMA 2015–7982 to R.M.S.), LSBR (1842F to R.M.S.), DFG (SFB 807 to R.T.), and ERC (Advanced, EditMHC to R.T.).
Data availability statement
The data that support the findings of this study are available from the corresponding author upon reasonable request.
References
- 1. McGonagle D, et al., Nat. Rev. Rheumatol. 2015. 11: 731–740. [DOI] [PubMed] [Google Scholar]
- 2. Halenius A, et al., Cell. Mol. Immunol. 2015. 12: 139–153. [DOI] [PMC free article] [PubMed] [Google Scholar]
- 3. Neefjes J, al., Nat. Rev. Immunol. 2011. 11: 823–836. [DOI] [PubMed] [Google Scholar]
- 4. Sade‐Feldman M, et al., Nat. Commun. 2017. 8: 1136. [DOI] [PMC free article] [PubMed] [Google Scholar]
- 5. Jongsma ML, et al., Immunity. 2020. 10.1016/j.immuni.2020.11.003. [DOI] [Google Scholar]
- 6. Trowitzsch S, and Tampé R. Annu. Rev. Biophys. 2020. 49: 135–161. [DOI] [PubMed] [Google Scholar]
- 7. van Asten SD, al., J. Virol. 2018. 92: e00260–18. [DOI] [PMC free article] [PubMed] [Google Scholar]
- 8. Schrodt S, et al., J. Biol. Chem. 2006. 281: 6455–6462. [DOI] [PubMed] [Google Scholar]
- 9. York IA, et al., Nat. Immunol. 2002. 3: 1177–1184. [DOI] [PubMed] [Google Scholar]
- 10. Danilczyk UG, J. Biol. Chem. 2000. 275: 13089–13097. [DOI] [PubMed] [Google Scholar]
- 11. Andreatta M, et al., Bioinformatics 2013. 29: 8–14. [DOI] [PubMed] [Google Scholar]
- 12. Yarzabek B, et al., Elife. 2018. 7: e34961.29989547 [Google Scholar]
- 13. Rasmussen M, et al., J. Immunol. 2014. 193: 4790–4802. [DOI] [PMC free article] [PubMed] [Google Scholar]
- 14. Mezzadra R, et al., PLoS One. 2019. 14: e0212053. [DOI] [PMC free article] [PubMed] [Google Scholar]
- 15. Rock KL, et al., Trends Immunol. 2016. 37: 724–737. [DOI] [PMC free article] [PubMed] [Google Scholar]
Associated Data
This section collects any data citations, data availability statements, or supplementary materials included in this article.
Supplementary Materials
Supporting Information
Data Availability Statement
The data that support the findings of this study are available from the corresponding author upon reasonable request.