Figure 2.

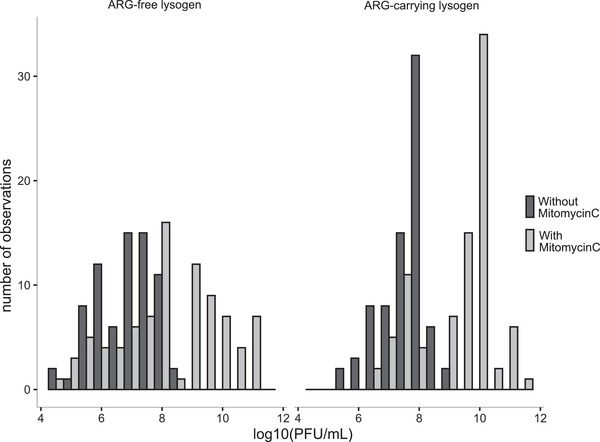
Production of free phages in the presence (grey) and absence (black) of mitomycin C. The number of cultures (y‐axis) with each amount of produced phages (x‐axis) is shown for competition cultures involving ARG‐free lysogens (left panel) and ARG‐carrying lysogens (right panel). Further details, including variation depending on all of the factors we tested and among replicates within each treatment group, are shown in Figure S3.
