

Abstract
Objective
To use the Clinical Global Impression‐Severity (CGI‐S) scale to estimate clinically meaningful and clinically substantial changes as measured using the Montgomery‐Åsberg Depression Rating Scale (MADRS), the Sheehan Disability Scale (SDS), and the Patient Health Questionnaire‐9 (PHQ‐9) in patients with treatment‐resistant depression (TRD).
Methods
Pooled data were derived from two 4‐week, randomized, active‐controlled studies evaluating esketamine nasal spray (ESK) plus oral antidepressant (OAD) or OAD plus placebo nasal spray (PBO) in adults with TRD (N = 565). CGI‐S, MADRS, SDS, and PHQ‐9 scores were obtained at baseline and over 4 weeks of treatment. In this post hoc analysis, change scores on the MADRS, SDS, and PHQ‐9 that corresponded to a clinically meaningful (1‐point) or clinically substantial (2‐point) change on the CGI‐S scale were identified.
Results
Clinically meaningful changes in CGI‐S scores after 28 days corresponded to 6‐, 4‐, and 3‐point changes from baseline on the MADRS, SDS, and PHQ‐9, respectively. Similarly, a 2‐point CGI‐S score change (clinically substantial change) corresponded to a 12‐, 8‐, and 6‐point change on the MADRS, SDS, and PHQ‐9, respectively. The proportion of patients showing substantial clinical improvement in the ESK plus OAD group versus the OAD plus PBO group after 28 days of treatment favored ESK plus OAD: 69.0% vs 55.3% (MADRS), 64.5% vs 48.9% (SDS), and 77.1% vs 64.7% (PHQ‐9).
Conclusion
We provide a basis for identifying clinically meaningful and clinically substantial changes as assessed with commonly used outcome measures for depression to facilitate the translation of clinical trial results into clinical practice.
Keywords: depression, antidepressives, clinical aspects, quality of life, treatment
Significant outcomes.
Based on study‐defined criteria (a 1‐point change in the Clinical Global Impression‐Severity [CGI‐S] score), clinically meaningful improvement in patients with moderate‐to‐severe symptoms of treatment‐resistant depression (TRD) corresponded to approximately 6‐, 4‐, and 3‐point improvements from baseline on the Montgomery‐Åsberg Depression Rating Scale (MADRS), Sheehan Disability Scale (SDS), and Patient Health Questionnaire‐9 (PHQ‐9), respectively. A 2‐point CGI‐S score change (a clinically substantial improvement in depressive symptoms and functioning) corresponded to a 12‐point change in MADRS, an 8‐point change in SDS, and a 6‐point change in PHQ‐9 scores.
The relationship between the CGI‐S and commonly used measures of depressive symptoms and patient‐reported outcomes will facilitate the translation of clinical trial results into clinical practice.
Limitations.
In these data sets, few patients had a worsening on the CGI‐S and few experienced improvements over 4 points. Therefore, the data supporting these observations are limited and may not be generalizable to worsening or to large clinical changes.
The relationships between the CGI‐S and the MADRS, SDS and PHQ‐9 were established in a moderately severe TRD population and may not be generalizable to severely ill subjects.
Inter‐rater reliability was not established for raters participating in the two studies on which this work was based. Consequently, substantial inter‐rater variability may exist for the CGI‐S ratings reported here. Both the SDS and the PHQ‐9 are patient‐rated outcomes.
The look‐back times for these three ratings were not equivalent. The MADRS captured symptomatology for the prior 24 h (on day 2) or for the previous 7 days at all other timepoints thereafter; the CGI‐S scale and SDS each captured symptomatology during the previous 7 days, whereas the PHQ‐9 captured symptomatology during the prior 2 weeks. Different raters and time frames may affect the relationship of change for the MADRS, SDS, and PHQ‐9 compared with CGI‐S changes.
1. INTRODUCTION
The successful management of treatment‐resistant depression (TRD) often requires a number of additional treatment steps to achieve symptomatic remission. 1 The systematic assessment of patients’ responses to treatment over time, whether by self‐report or clinician‐rated scales, can aid in making decisions about when, how, and whether to continue, adjust, augment, or change treatments. 2 This approach, often called measurement‐based care, improves clinical outcomes. 3 Furthermore, this approach helps to bridge the gap between clinical practice and evidence from clinical trials, 4 where symptom rating scales are used to assess antidepressant efficacy.
In managing treatment for depression, clinicians often must decide whether a clinically meaningful result has been achieved to determine whether to adjust, augment, or change the treatment. However, metrics to inform this decision are not yet widely established, particularly for TRD. Several approaches are available to determine a clinically meaningful degree of symptomatic deterioration or improvement in patients with major depressive disorder (MDD). The most widely used approach considers a reduction of baseline severity of symptoms of at least 50% to be clinically meaningful. 5 However, this criterion is arbitrary and heavily influenced by baseline severity. It has been challenged by a report on patients with TRD, which found that a 35% reduction in the Montgomery‐Åsberg Depression Rating Scale (MADRS) score was associated with a clinically meaningful degree of improvement in quality of life 6 as assessed by the Quality of Life Enjoyment and Satisfaction Questionnaire. 7
Another approach is to employ a clinical global measure of disease severity (e.g., the Clinical Global Impression‐Severity [CGI‐S] scale) 8 and to establish the meaning of a unit change on the global measure of severity relative to other scales, including depressive symptoms, function, or quality of life determined by patient self‐reporting or clinician assessment. Because use of the CGI‐S scale provides a rapid, clinically intuitive assessment of both functioning and symptoms, it readily measures overall severity of depression. The CGI‐S scale also better reflects real‐world clinical practice.
Patient‐reported outcome (PRO) measures including the Sheehan Disability Scale (SDS) 9 and the 9‐item Patient Health Questionnaire (PHQ‐9) 10 , 11 are used to assess functional impairment and depressive symptoms, respectively, in depressed patients. PROs are being used more frequently in mental health care to augment clinical judgment, with increasing recognition that their use enhances the therapeutic relationship, improves treatment adherence, and brings focus to the patient‐clinician collaboration, enabling patients to be more informed, engaged, and activated. 12
Data supporting the current analyses came from studies evaluating the clinical value of 4‐week treatment with a novel adjunctive therapy added to standard of care (oral antidepressant [OAD] plus esketamine nasal spray [ESK]) compared to standard of care alone (OAD plus placebo nasal spray [PBO]). These post hoc analyses facilitate interpretation of the clinical significance of the study's symptomatic and functional findings based on scales (MADRS, SDS, and PHQ‐9 change scores), which individually do not completely capture disease severity against a broad global measure of improvement (CGI‐S). Based on clinical consensus, and in alignment with prior studies, 13 a change of ≥1 point on the CGI‐S scale was considered clinically meaningful, and a change of ≥2 points was considered clinically substantial.
1.1. Aims of the study
This post hoc analysis used the CGI‐S scale to estimate a clinically meaningful and substantial change in MADRS, SDS, and PHQ‐9 in patients with TRD participating in two pooled 4‐week double‐blind, active‐controlled studies, with the aim of assisting the interpretation of differential treatment effects and clinically relevant thresholds using these scales.
2. METHODS
2.1. Patients
Data for this post hoc analysis were pooled from two (N = 565) 4‐week, randomized, active‐controlled studies (NCT02417064, NCT02418585) of ESK plus newly initiated OAD therapy versus newly initiated OAD therapy plus PBO. The studies included symptomatic patients (aged 18–64 years old) who had not benefited from ≥2 prior pharmacologic antidepressant treatments during the current major depressive episode (assessed by Massachusetts General Hospital Antidepressant Treatment Response Questionnaire) and were therefore considered to have TRD. Patients met the Diagnostic and Statistical Manual of Mental Disorders, 5th edition (DSM‐5) diagnostic criteria for single‐episode or recurrent MDD, without psychotic features, based upon clinical assessment and confirmed by the Mini‐International Neuropsychiatric Interview. 14
Patients were excluded if they had previously demonstrated non‐response of depressive symptoms to all 4 OAD options available for the double‐blind induction phase (duloxetine, escitalopram, sertraline, and venlafaxine extended release [XR]), previous non‐response to ketamine or esketamine, or had received vagal nerve stimulation or deep brain stimulation in the current episode of depression. Full inclusion/exclusion criteria have been published previously. 15 , 16
2.2. Study design
This post hoc analysis explored the relationship between ratings on the MADRS and the CGI‐S scales measured in the same patients by determining change scores on the MADRS that correspond to a 1‐point and 2‐point change on the CGI‐S scale. Similar relationships for changes were explored for the SDS and the PHQ‐9.
All patients were rated using the CGI‐S scale (at baseline and on days 4, 8, 15, 22, and 28), which permits a global evaluation of a patient's condition at a given time; MADRS (at baseline and on days 2, 8, 15, 22, and 28), with a recall period of 7 days for this study (except on day 2, which was for 24 hours) 17 ; SDS (at baseline and on days 15 and 28), with a recall period of 7 days; and PHQ‐9 (at baseline and on days 15 and 28), with a recall period of 2 weeks. Note that remote independent raters completed all MADRS assessments to reduce potential bias on this primary efficacy outcome measure and potential unblinding owing to awareness of side effects. In contrast, assessment of the CGI‐S scale was conducted by the blinded site‐based rater. Both the SDS and the PHQ‐9 are patient‐rated outcomes.
2.3. Statistical analysis
Parametric and non‐parametric simple and multiple regression models were used to explore relationships between MADRS, SDS, and PHQ‐9 ratings and the CGI‐S scale score from baseline to the week 4 end point as dependent variables. Mixed‐model repeated measures analyses were used to account for additional data points from each visit, and within‐subject correlations were modeled using an unstructured covariance matrix. Assumptions, including a linear relationship between variables and equal variances of error terms, were evaluated. Regression coefficients and r 2 were assessed at each visit to illustrate consistency of observed estimates. Ordinal logistic regression models were used to determine expected values of MADRS, SDS, and PHQ‐9 at day 28 for each score of the CGI‐S scale as well as each anchor point in the CGI‐S scale. Additional logistic regression models were fitted using the change score of the CGI‐S scale as a categorical covariate. The categories of change in the CGI‐S scale were defined as improvement in severity score (being lowered by one or more units); unchanged (0); or worsening (severity score increased by one or more units). Linking analyses were performed as sensitivity analyses to determine the correspondence of the CGI‐S scale score to the MADRS, SDS, and PHQ‐9 scores, by mapping percentiles of the cumulative distribution of observed values for the 2 scales at baseline and each subsequent measurement, according to the Leucht method. 18 The equipercentile equating involved first determining percentile ranks for the CGI‐S and MADRS, SDS, and PHQ‐9 scales, and then, individual scores on the CGI‐S scale and relevant scale with equipercentile rank were matched together. Equipercentile equating defines a non‐linear relationship between scales by setting the percentile ranks equal for each point. The non‐linear relationships between the CGI‐S and MADRS, SDS, and PHQ‐9 scales were also established using local regression models to identity corresponding observed scores for CGI‐S scores of 3 (mildly ill) and 4 (moderately ill) to further assist with interpretability. The proportions of patients demonstrating clinically meaningful and substantial improvements were provided for both treatment groups. Rate differences between the treatment groups along with 95% CIs were computed. The 95% CIs that do not include zero correspond to a two‐sided P‐value <0.05 using a chi‐square test statistic. No adjustment was made for multiplicity.
3. RESULTS
Patient disposition is shown in Figure S1, and baseline demographics are shown in Table 1.
Table 1.
Baseline demographic and clinical characteristics.
| Demographic characteristics | Overall (N = 565) |
|---|---|
| Age, mean (SD), years | 46.1 (11.5) |
| Female, n (%) | 379 (67.1) |
| Race, n (%) | |
| Caucasian | 470 (87.0) |
| Black or African American | 30 (5.6) |
| Asian | 7 (1.3) |
| Other | 33 (6.1) |
| Region, n (%) | |
| North America | 244 (43.2) |
| Europe | 219 (38.8) |
| Other | 102 (18.1) |
| Class of antidepressants, n (%) | |
| SNRI | 348 (61.6) |
| SSRI | 217 (38.4) |
| Clinical characteristics | |
| Duration of current depressive episode, mean (SD), weeks | 168.1 (250.2) |
| Duration of current depressive episode, median (range), weeks | 84.0 (6, 2288) |
| Age when diagnosed with major depressive disorder, mean (SD), years | 32.3 (12.7) |
| CGI‐S score, mean (SD) | 5.1 (0.7) |
| PHQ‐9 total score, mean (SD) | 20.5 (3.8) |
| SDS total score, mean (SD) | 24.3 (4.2) |
| MADRS total score, mean (SD) | 37.4 (5.6) |
CGI‐S, Clinical Global Impression–Severity; MADRS, Montgomery‐Åsberg Depression Rating Scale; PHQ‐9, 9‐item Patient Health Questionnaire; SD, standard deviation; SDS, Sheehan Disability Scale; SNRI, serotonin and norepinephrine reuptake inhibitor; SSRI, selective serotonin reuptake inhibitor.
Few patients. Furthermore, few patients experienced over a 4‐point improvement on the CGI‐S score. Results from simple and multiple regression models, including repeated measures analyses, are shown in Table 2. With multiple regression, a 1‐point change in the CGI‐S scale (considered clinically meaningful) from baseline to day 28 corresponded to a 6.7‐point (standard error [SE], 0.3) change from baseline in the MADRS, a 4.4‐point (SE, 0.2) change from baseline in the SDS, and a 3.6‐point (SE, 0.2) change from baseline in the PHQ‐9. After examining results from all other models and scale specific literature in the moderately ill patient population with TRD, in this analysis a 1‐point improvement on the CGI‐S scale corresponded to a 6‐point change in MADRS score, a 4‐point change in SDS score, and a 3‐point change in PHQ‐9 score. Subsequently confirming the linearity assumption between the CGI‐S and other scales at the most frequently observed change scores for the CGI‐S at day 28, a 2‐point improvement on the CGI‐S scale (considered clinically substantial) corresponded to a 12‐point change in MADRS score, an 8‐point change in SDS score, and a 6‐point change in PHQ‐9 score. Results from these analyses were used to interpret the findings from the clinical studies.
Table 2.
MADRS, SDS, and PHQ‐9 total changes (baseline to end point) over 4 weeks during double‐blind induction phase associated with a 1‐point change on the CGI‐S scale at day 28.
| MADRS total change | SDS total change | PHQ‐9 total change | |
|---|---|---|---|
| Simple regression | |||
| Estimate (SE) | 7.3 (0.27) | 4.5 (0.21) | 3.8 (0.16) |
| 95% CI | 6.7–7.8 | 4.1–4.9 | 3.5–4.1 |
| r 2 | 0.583 | 0.522 | 0.514 |
| Multiple regression | |||
| Estimate (SE) | 6.7 (0.27) | 4.4 (0.20) | 3.6 (0.15) |
| 95% CI | 6.2–7.2 | 4.0–4.8 | 3.3–3.9 |
| r 2 | 0.637 | 0.565 | 0.606 |
| Repeated measures ANCOVA | |||
| Estimate (SE) | 5.5 (0.17) | 4.4 (0.18) | 3.5 (0.13) |
| 95% CI | 5.1–5.8 | 4.0–4.8 | 3.2–3.7 |
ANCOVA, analysis of covariance; CGI‐S, Clinical Global Impression–Severity; MADRS, Montgomery‐Åsberg Depression Rating Scale; PHQ‐9, 9‐item Patient Health Questionnaire; SDS, Sheehan Disability Scale; SE, standard error.
ANCOVA models included explanatory study design variables for treatment, country, class of antidepressant (SNRIs or SSRIs), study as fixed effect factors and baseline score as covariate. Repeated measures ANCOVA models also included time as a categorical factor and incorporated information from all the other visits.
The proportion of patients demonstrating clinically meaningful improvement at specific measurement time points (i.e., day 2 and day 15 for MADRS, day 15 for PHQ‐9 and SDS) and the proportion of patients demonstrating clinically substantial improvement by the latest measurement time (day 28) are shown in Table 3. The proportion of patients with a clinically substantial improvement at the end of the study period on the MADRS, SDS, and PHQ‐9 was significantly higher in the ESK plus OAD group than in the OAD plus PBO group. At day 28, none of the 95% CIs included zero (0), indicating that rate differences between ESK plus OAD and OAD plus PBO groups reached statistical significance in favor of ESK plus OAD. Rate differences favoring the ESK plus OAD group were observed for clinically meaningful change on the SDS (10.1%) and PHQ‐9 (7.3%) scales at day 15, but these differences did not reach statistical significance.
Table 3.
Proportion of patients demonstrating a clinically meaningful (1‐point) improvement at the earliest measurable time point and a clinically substantial (2‐point) improvement at day 28 in MADRS, SDS, and PHQ‐9 scores.
| Scale |
AD + PBO n (%) |
ESK + AD n (%) |
Rate Difference % (95% CI)* |
|---|---|---|---|
| MADRS | |||
| 6‐point change at day 2 † | 86 (42.4) | 192 (60.4) | 18.0 (9.3 to 26.7) |
| 6‐point change at day 15 | 121 (58.2) | 219 (69.3) | 11.1 (2.7 to 19.5) |
| 12‐point change at day 28 | 115 (55.3) | 214 (69.0) | 13.7 (5.2 to 22.2) |
| SDS | |||
| 4‐point change at day 15 | 41 (47.7) | 78 (57.8) | 10.1 (–3.3 to 23.6) |
| 8‐point change at day 28 | 85 (48.9) | 167 (64.5) | 15.6 (6.2 to 25.1) |
| PHQ‐9 | |||
| 3‐point change at day 15 | 148 (68.5) | 251 (75.8) | 7.3 (–0.4 to 15.0) |
| 6‐point change at day 28 | 134 (64.7) | 239 (77.1) | 12.4 (4.3 to 20.4) |
AD, antidepressant; ESK, esketamine nasal spray; MADRS, Montgomery‐Åsberg Depression Rating Scale; PBO, placebo nasal spray; PHQ‐9, 9‐item Patient Health Questionnaire; SDS, Sheehan Disability Scale.
95% CIs that do not include zero correspond to a two‐sided P‐value <0.05 using a chi‐square test statistic.
For day 2 assessments, MADRS was administered using a modified recall period of 24 h rather than 7 days.
Potential outliers and influential data points were not omitted in these regression analyses. Assuming potential deviations from linearity for sensitivity analyses purposes, proportional odds models were used to examine the relationship between CGI‐S scores at end point and MADRS, SDS, and PHQ‐9 scores (Table 4). Predicted probabilities were listed for widely used scoring categories for MADRS, SDS, and PHQ‐9 scores. The logistic regression model of CGI‐S categories of change suggested an average 21% probability of a one‐category shift at day 28 when the MADRS total score changed by 1 unit. Using the SDS as a predictor, there was, on average, a 26% probability of a shift in one CGI‐S category at day 28 when the SDS score changed by 1 unit. And when using PHQ‐9 as a predictor, there was, on average, a 37% probability of a shift in one CGI‐S category at day 28 when the PHQ‐9 score changed by 1 unit.
Table 4.
Distribution of MADRS, SDS, and PHQ‐9 total scores by CGI‐S score at day 28 (probabilities ≥20% are highlighted).
| Predictive probability of MADRS total score at day 28 | ||||||||||
|---|---|---|---|---|---|---|---|---|---|---|
| 0–6 (n = 116) | 7–12 (n = 84) | 13–19 (n = 84) | 20–34 (n = 174) | >34 (n = 104) | ||||||
| CGI‐S | n | % | n | % | n | % | n | % | n | % |
| 1 = normal | 42 | 38.2 | 10 | 12.3 | 1 | 1.2 | 0 | 0 | 0 | 0 |
| 2 = minimally ill | 35 | 31.8 | 33 | 40.7 | 26 | 32.1 | 5 | 3.2 | 0 | 0 |
| 3 = mildly ill | 30 | 27.3 | 32 | 39.5 | 39 | 48.1 | 27 | 17.5 | 0 | 0 |
| 4 = moderately ill | 3 | 2.7 | 5 | 6.2 | 14 | 17.3 | 81 | 52.6 | 24 | 28.9 |
| 5 = markedly ill | 0 | 0 | 1 | 1.2 | 1 | 1.2 | 35 | 22.7 | 45 | 54.2 |
| 6, 7 = severely ill, extremely ill | 0 | 0 | 0 | 0 | 0 | 0 | 6 | 3.9 | 14 | 16.8 |
| Predictive probability of SDS total score at day 28 | ||||||||
|---|---|---|---|---|---|---|---|---|
| 0–4 (n = 102) | 5–8 (n = 57) | 9–14 (n = 82) | >14 (n = 231) | |||||
| CGI‐S | n | % | n | % | n | % | n | % |
| 1 = normal | 36 | 36.0 | 6 | 10.5 | 3 | 4.0 | 0 | 0 |
| 2 = minimally ill | 33 | 33.0 | 21 | 36.8 | 15 | 20.0 | 8 | 4.0 |
| 3 = mildly ill | 28 | 28.0 | 21 | 36.8 | 29 | 38.7 | 25 | 12.6 |
| 4 = moderately ill | 3 | 3.0 | 7 | 12.3 | 19 | 25.3 | 83 | 41.9 |
| 5 = markedly ill | 0 | 0 | 2 | 3.5 | 8 | 10.7 | 65 | 32.8 |
| 6, 7 = severely ill, extremely ill | 0 | 0 | 0 | 0 | 1 | 1.3 | 17 | 8.6 |
| Predictive probability of PHQ−9 total score at day 28 | ||||||||||
|---|---|---|---|---|---|---|---|---|---|---|
| 0–4 (n = 162) | 5–9 (n = 155) | 10–14 (n = 74) | 15–19 (n = 77) | 20–27 (n = 86) | ||||||
| CGI‐S | n | % | n | % | n | % | n | % | n | % |
| 1 = normal | 43 | 27.4 | 10 | 6.9 | 0 | 0 | 0 | 0 | 0 | 0 |
| 2 = minimally ill | 60 | 38.2 | 31 | 21.4 | 6 | 8.8 | 1 | 1.6 | 0 | 0 |
| 3 = mildly ill | 45 | 28.7 | 68 | 46.9 | 10 | 14.7 | 3 | 4.8 | 0 | 0 |
| 4 = moderately ill | 9 | 5.7 | 29 | 20.0 | 39 | 57.4 | 35 | 55.6 | 16 | 21.3 |
| 5 = markedly ill | 0 | 0 | 7 | 4.8 | 12 | 17.6 | 28 | 28.6 | 46 | 61.3 |
| 6, 7 = severely ill, extremely ill | 0 | 0 | 0 | 0 | 1 | 1.5 | 6 | 9.5 | 13 | 17.3 |
CGI‐S, Clinical Global Impression‐Severity; MADRS, Montgomery‐Åsberg Depression Rating Scale; PHQ‐9, 9‐item Patient Health Questionnaire; SDS, Sheehan Disability Scale.
Highlighted cells (probabilities ≥20%) indicate the relationship between the CGI‐S scale at end point and MADRS, SDS, and PHQ‐9 total scores at end point, e.g., higher MADRS, SDS, and PHQ‐9 total scores are associated with more severe illness, while lower total scores are associated with less severe illness. [Colour figure can be viewed at wileyonlinelibrary.com]
Equipercentile linking results between the CGI‐S scale and the MADRS, SDS, and PHQ‐9 total scores at each time point and for the combined data set are shown in Figure 1. The relationship between the CGI‐S score and the MADRS, SDS, and PHQ‐9 total scores seemed to follow a non‐linear trend. Results suggest that being “mildly ill” and “moderately ill” (CGI‐S = 3 and 4, respectively) corresponded to a MADRS total score of approximately 13.4 (95% CI: 12.1–14.7) and 26.7 (95% CI: 25.7–28.3), respectively, at day 28. Similarly, being considered “markedly ill” (CGI‐S = 5) corresponded to a MADRS total score of approximately 33.7 (95% CI: 32.5–35.0) at day 28. The relationship between the 2 variables at each visit showed consistency with increasing correlation coefficients over time.
Figure 1.
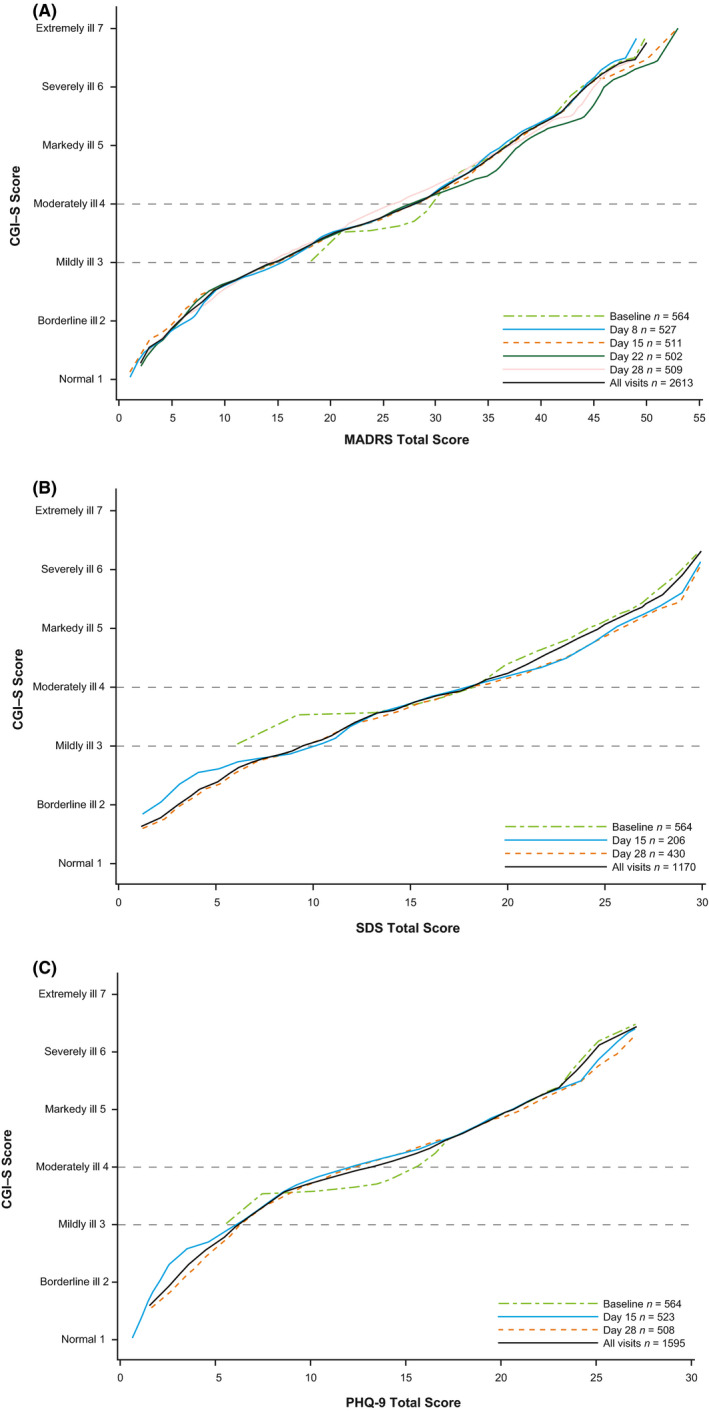
Relationship between CGI‐S and (A) MADRS total scores, (B) SDS total scores, and (C) PHQ‐9 total scores by visit using local equipercentile method. PHQ‐9 scale maximum score is 27. CGI‐S, Clinical Global Impression‐Severity; MADRS, Montgomery‐Åsberg Depression Rating Scale; PHQ‐9, 9‐item Patient Health Questionnaire; SDS, Sheehan Disability Scale.
4. DISCUSSION
In adults with TRD, a clinically meaningful improvement in depressive symptoms and functioning, as assessed by a change of 1 point on the CGI‐S scale, corresponded to approximately 6‐, 4‐, and 3‐point reductions in total scores from baseline on the MADRS, SDS, and PHQ‐9, respectively. Similarly, based on their relationships to the CGI‐S scale at day 28, indicators for clinically substantial improvement (a 2‐point change in the CGI‐S scale) were a 12‐point reduction in MADRS score, an 8‐point reduction in SDS score, and a 6‐point reduction in PHQ‐9 score.
The CGI‐S scale is widely used to measure global clinical outcomes in symptom severity and treatment efficacy in patients with psychiatric disorders other than depression. 19 , 20 , 21 , 22 In this study, the CGI‐S scale was used as the reference measure against which MADRS, SDS, and PHQ‐9 were compared in the acute‐phase treatment of TRD. Change on CGI‐S scale has strong face validity, and the usefulness of this measurement approach is reflected in many disorder‐specific CGI scales being introduced into clinical trials and observational studies, among them the CGI for schizophrenia (CGI‐SCH), 20 for bipolar disorder (CGI‐BP), 21 , 23 and more recently, for schizoaffective disorder (CGI‐S‐SCA). 22
Although not yet widely used by clinicians, 24 the integration of measurement tools such as MADRS, SDS, and PHQ‐9 into routine psychiatric management may enhance the quality of care and improve clinical outcomes. 25 Clinician‐rated and/or patient‐rated scales can help characterize the trajectory of the disease course and the effects of treatment. The scales can also be useful in monitoring symptoms and personalizing treatment dosing and patient management, as illustrated by measurement‐based care. 26 , 27 Determining an optimal cutoff score and showing sensitivity to change are essential for clinical utility of measurement tools. The ability of a measure to detect meaningful change in depression is especially important because follow‐up visits for depression care are often brief and treatment adjustments are frequently necessary to optimize outcomes. 28
Limitations have been noted for each of these scales. Previous studies using the MADRS in MDD have been inconsistent with respect to the multidimensionality of this scale—up to 4 different factor structures have been suggested. 29 The SDS assesses functional impairment globally in three domains (work/school, social life/leisure activities, and family life/home responsibilities) 9 but does not identify the types of impairment. For current major depressive episode, some studies suggest that the specificity and predictive positive value of PHQ‐9 are low 30 and the PHQ‐9 substantially overestimates depression prevalence. 31 The CGI‐S scale also has some inherent limitations as it requires clinicians to make judgments based on a global approximation of illness severity, patients’ level of distress and other aspects of impairment, and the impact of the illness on functioning. Standardization of rating across clinical sites typically does not occur; thus, neither inter‐rater reliability nor a consensus regarding to what degree each rating relies on symptoms, daily function, or patient satisfaction has been standardized. Nevertheless, global CGI‐S ratings reflect the current assessment process in real‐world practice and allow for a clinically acceptable definition of meaningful and substantial change with real‐world applicability.
A strength of our analysis is that, although MADRS and CGI‐S scale are both clinician‐reported outcomes, their assessments were not conducted by the same rater in the current study, which may improve the generalizability of the relationship and, at the same time, may decrease the expected correlation between change scores. Several limitations of our study should be considered. For example, a 1‐ or 2‐unit change on the CGI‐S scale likely differs in clinical relevance depending on the patient's baseline score. One can argue that the relevance of a 1‐point change between the CGI‐S levels of markedly ill to moderately ill and mildly ill to minimally ill may not be the same. Few patients worsened on the CGI‐S or had an improvement greater than 4 points. The linearity of these relationships across the full spectrum of disease severity and having an insufficient amount of study participants for this magnitude of change score ranges may have severely biased the linearity assumption. After mapping the CGI‐S scores to other scale scores, potential outliers and influential data points were identified, and those scores were not omitted. Since these analyses were carried out in a treatment‐resistant population undergoing 4 weeks of acute treatment, the generalizability of these results to patients with less resistant or less chronic depression who are undergoing treatment of different durations may be limited. This is evident in the slight deviation of equipercentile linking results for the MADRS and CGI‐S with previous findings reported for MDD, although differences in study design limit direct comparison. In an equipercentile linking analysis of data from clinical trials of mirtazapine in MDD, Leucht et al. found that a CGI‐S score of 3 (“mildly ill”) corresponded to MADRS scores of 15 to 20; a CGI‐S score of 4 (“moderately ill”) corresponded to MADRS scores of 22 to 27, and a CGI‐S score of 5 (“markedly ill”) corresponded to MADRS scores of 31–34. 13 They also suggested that a reduction of one severity step on the CGI‐S corresponded to a reduction of about 8–9 points on MADRS in non‐TRD patients.
Several metrics have been devised to quantify the minimum clinically important difference (MID). Our objective in this study was to explore the relationship between changes in CGI‐S score to those in the MADRS, SDS, and PHQ‐9 scores. Distribution and anchor‐based methods 32 , 33 are available to examine disease‐specific MIDs. The distribution approach to MID uses the effect size of the difference between groups to measure variability, standardized response mean, standard error of measurement, and responsiveness statistics. In contrast, most anchor‐based approaches do not consider the measurement precision of the outcome instrument but are instead based on external criteria such as retrospective clinical judgment of change and are therefore presumed to be sample‐independent. Specific inclusion and exclusion criteria may result in samples of patients with different distributions of MID. 34 The anchor‐based method is not considered suitable for conditions in which most patients will improve, and few remain unchanged. 35 It also has limited interpretability when the size of change score is a function of baseline severity, and the level or intensity of change is not linear.
Additional studies and alternate methodologic approaches to investigate interpretation of change on these scales are needed to confirm these findings. It would be particularly valuable to conduct such approaches with patients with varying levels of disease severity and those who demonstrate broader ranges of change, as this would help establish whether these relationships hold and whether these metrics are appropriate. Different methods are also available to assist with interpretation of scores. Such additional work would contribute to a deeper understanding and interpretation of these assessments.
In the present post hoc analysis, clinically meaningful and clinically substantial change scores for each scale were captured using within patient change scores. It is important to note that translating within patient change scores into MIDs between treatment groups is problematic because within patient change scores do not account for the costs and benefits of two treatments and are not intrinsically related to between group treatment differences. 36 , 37 However, as suggested by Furukawa, 36 comparison of the proportions of patients demonstrating MID between treatment groups is appropriate. Using this approach, we found that the proportion of patients with a clinically substantial improvement at the end of the study period on the scales assessing depressive symptomology and functioning (MADRS, SDS, and PHQ‐9) was significantly greater in the esketamine nasal spray plus OAD group than in the OAD plus placebo nasal spray group. We did not observe statistically significant differences in proportions of patients with clinically meaningful improvement at an earlier timepoint (day 15) for the SDS and PHQ‐9 scales. This may be attributable to characteristics of the SDS and PHQ‐9 scales versus the MADRS. The SDS, as a measure of functioning, may show a slower onset of effect than scales measuring symptoms, and the PHQ‐9 assesses symptoms over a 2‐week recall period (versus a 1‐week recall period for the MADRS), potentially contributing to a delayed effect.
Future research should involve the application of clinically meaningful and clinically substantial improvements in MADRS, SDS, and PHQ‐9 scores to real‐world populations of patients with TRD when initiating new antidepressant treatment. Further work in other populations with depression is important to assist in the generalizability and interpretation of these outcome assessment instruments.
Effective treatment of depression should not only address symptom control but also promote treatment adherence, functional restoration, and relapse prevention. 38 Assessments of how well these goals are achieved provide clinicians and patients with a means by which to adjust treatment for the individual patient. Results in this report show that thresholds for clinically meaningful and clinically substantial degrees of change can be established for both depressive symptoms (MADRS and PHQ‐9) and function (SDS). The thresholds for clinically substantial changes enable clinicians to more precisely gauge the success of a treatment for reducing depressive symptoms and improving function. Overall, the findings of the present report provide a greater understanding and interpretability of results from clinical trials in depression and application of these measures to clinical practice.
CONFLICTS OF INTEREST
IT, CJ, ED, MS, and JJS are employees of Janssen Pharmaceuticals. JS is a former employee of Janssen Pharmaceuticals and is currently employed at Neurocrine Biosciences. MHT has received consulting fees from Allergan, Alto Neuroscience Inc, Applied Clinical Intelligence, LLC, Axsome Therapeutics, Boehringer Ingelheim, Engage Health Media, GreenLight VitalSign6 Inc, Janssen, Lundbeck Research USA, Merck Sharp & Dohme Corp., Navitor Pharmaceutical, Inc., Otsuka, Perception Neuroscience, Pharmerit International, SAGE Therapeutics, Signant Health; research support from the NIMH, NIDA, Patient‐Centered Outcomes Research Institute (PCORI), Cancer Prevention Research Institute of Texas (CPRIT); editorial compensation from the American Psychiatric Association (Deputy Editor for American Journal of Psychiatry), Oxford University Press. LA is a former employee of Janssen Pharmaceuticals and holds stock in Johnson & Johnson, Inc. AJR has received consulting fees from Compass Inc., Curbstone Consultant LLC, Emmes Corp., Holmusk, Johnson and Johnson (Janssen), Liva‐Nova, Neurocrine Biosciences Inc., Otsuka‐US, Sunovion; speaking fees from Liva‐Nova, Johnson and Johnson (Janssen); and royalties from Guilford Press and the University of Texas Southwestern Medical Center, Dallas, TX (for the Inventory of Depressive Symptoms and its derivatives). He is also named co‐inventor on two patents: U.S. Patent No. 7,795,033: Methods to Predict the Outcome of Treatment with Antidepressant Medication, Inventors: McMahon FJ, Laje G, Manji H, Rush AJ, Paddock S, Wilson AS; and U.S. Patent No. 7,906,283: Methods to Identify Patients at Risk of Developing Adverse Events During Treatment with Antidepressant Medication, Inventors: McMahon FJ, Laje G, Manji H, Rush AJ, Paddock S.
Peer Review
The peer review history for this article is available at https://publons.com/publon/10.1111/acps.13260.
Supporting information
Figure S1
ACKNOWLEDGMENTS
The authors thank Tabasum Mughal, PhD, Louise Brady, PhD (ApotheCom, UK), and Madeline Pfau, PhD (ApotheCom, US) for writing and editorial services, which were funded by Janssen Scientific Affairs, LLC. All authors have reviewed and approved the final version of this article. This research was funded by Janssen Scientific Affairs, LLC.
DATA AVAILABILITY STATEMENT
The data sharing policy of Janssen Pharmaceutical Companies of Johnson & Johnson is available at https://www.janssen.com/clinical‐trials/transparency. As noted on this site, requests for access to the study data can be submitted through Yale Open Data Access (YODA) Project site at http://yoda.yale.edu.
REFERENCES
- 1. Rush AJ, Trivedi MH, Wisniewski SR, et al. Acute and longer‐term outcomes in depressed outpatients requiring one or several treatment steps: a STAR*D report. Am J Psychiatry. 2006;163:1905‐1917. [DOI] [PubMed] [Google Scholar]
- 2. Trivedi MH. Evaluating and monitoring treatment response in depression using measurement‐based assessment and rating scales. J Clin Psychiatry. 2013;74:e14. [DOI] [PubMed] [Google Scholar]
- 3. Rush AJ. Isn't it about time to employ measurement‐based care in practice? Am J Psychiatry. 2015;172:934‐936. [DOI] [PubMed] [Google Scholar]
- 4. Rush AJ. Narrowing the gaps between what we know and what we do in psychiatry. J Clin Psychiatry. 2015;76:1366‐1372. [DOI] [PubMed] [Google Scholar]
- 5. Rush AJ, Kraemer HC, Sackheim HA, et al. Report by the ACNP task force on response and remission in major depressive disorder. Neuropsychopharmacology. 2006;31:1841‐1853. [DOI] [PubMed] [Google Scholar]
- 6. Conway CR, Kumar A, Xiong W, Bunker M, Aaronson ST, Rush AJ. Chronic vagus nerve stimulation significantly improves quality of life in treatment‐resistant major depression. J Clin Psychiatry. 2018;79:18m12178. [DOI] [PubMed] [Google Scholar]
- 7. Gaynes BN, Asher G, Gartlehner G, et al. Definition of Treatment‐Resistant Depression in the Medicare Population. Rockville, MD: Agency for Healthcare Research and Quality; 2018. [PubMed] [Google Scholar]
- 8. Guy W. Clinical Global Impressions. ECDEU Assessment Manual for Psychopharmacology. Rockville, MD: National Institute of Mental Health; 1976. [Google Scholar]
- 9. Sheehan KH, Sheehan DV. Assessing treatment effects in clinical trials with the discan metric of the Sheehan Disability Scale. Int Clin Psychopharmacol. 2008;23:70‐83. [DOI] [PubMed] [Google Scholar]
- 10. Löwe B, Unützer J, Callahan CM, Perkins AJ, Kroenke K. Monitoring depression treatment outcomes with the patient health questionnaire‐9. Med Care. 2004;42:1194‐1201. [DOI] [PubMed] [Google Scholar]
- 11. Kroenke K, Spitzer RL, Williams JB. The PHQ‐9: validity of a brief depression severity measure. J Gen Intern Med. 2001;16:606‐613. [DOI] [PMC free article] [PubMed] [Google Scholar]
- 12. Peterson K, Anderson J, Bourne D. Evidence Brief: Use of Patient Reported Outcome Measures for Measurement Based Care in Mental Health Shared Decision‐Making. Washington, DC: US Department of Veterans Affairs; 2018. [PubMed] [Google Scholar]
- 13. Leucht S, Fennema H, Engel RR, Kaspers‐Janssen M, Lepping P, Szegedi A. What does the MADRS mean? Equipercentile linking with the CGI using a company database of mirtazapine studies. J Affect Disord. 2017;210:287‐293. [DOI] [PubMed] [Google Scholar]
- 14. Sheehan DV, Lecrubier Y, Harnett Sheehan K, et al. The Mini‐International Neuropsychiatric Interview (M.I.N.I.): the development and validation of a structured diagnostic psychiatric interview for DSM‐IV and ICD‐10. J Clin Psychiatry. 1998;59:22‐33. [PubMed] [Google Scholar]
- 15. Fedgchin M, Trivedi M, Daly EJ, et al. Efficacy and safety of fixed‐dose esketamine nasal spray combined with a new oral antidepressant in treatment‐resistant depression: results of a randomized, double‐blind, active‐controlled study (TRANSFORM‐1). Int J Neuropsychopharmacol. 2019;22:616‐630. [DOI] [PMC free article] [PubMed] [Google Scholar]
- 16. Popova V, Daly EJ, Trivedi M, et al. Efficacy and safety of flexibly dosed esketamine nasal spray combined with a newly initiated oral antidepressant in treatment‐resistant depression: a randomized double‐blind active‐controlled study. Am J Psychiatry. 2019;176:428‐438. [DOI] [PubMed] [Google Scholar]
- 17. Johnson KM, Devine JM, Ho KF, Howard KA, Saretsky TL, Jamieson CA. Evidence to support Montgomery‐Asberg Depression Rating Scale administration every 24 hours to assess rapid onset of treatment response. J Clin Psychiatry. 2016;77:1681‐1686. [DOI] [PubMed] [Google Scholar]
- 18. Leucht S, Kane JM, Kissling W, Hamann J, Etschel E, Engel RR. What does the PANSS mean? Schizophr Res. 2005;79:231‐238. [DOI] [PubMed] [Google Scholar]
- 19. Guy W. Clinical Global Impression. ECDEU Assessment Manual for Psychopharmacology. Rockville, MD: National Institute of Mental Health; 1976. [Google Scholar]
- 20. Haro JM, Kamath SA, Ochoa S, et al. The Clinical Global Impression‐Schizophrenia scale: a simple instrument to measure the diversity of symptoms present in schizophrenia. Acta Psychiatr Scand Suppl. 2003;416:16‐23. [DOI] [PubMed] [Google Scholar]
- 21. Spearing MK, Post RM, Leverich GS, Brandt D, Nolen W. Modification of the Clinical Global Impressions (CGI) scale for use in bipolar illness (BP): the CGI‐BP. Psychiatry Res. 1997;73:159‐171. [DOI] [PubMed] [Google Scholar]
- 22. Turkoz I, Fu DJ, Bossie CA, Sheehan JJ, Alphs L. Relationship between the clinical global impression of severity for schizoaffective disorder scale and established mood scales for mania and depression. J Affect Disord. 2013;150:17‐22. [DOI] [PubMed] [Google Scholar]
- 23. Tohen M, Sanger TM, McElroy SL, et al. Olanzapine versus placebo in the treatment of acute mania. Olanzapine HGEH Study Group. Am J Psychiatry. 1999;156:702‐709. [DOI] [PubMed] [Google Scholar]
- 24. Davis T, Liberman JN, Allen A, et al. Patient reported outcomes (PRO) collected as part of the clinical process: the challenge of administering, scoring, storing, and interpreting PHQ‐9 scores beyond the clinical moment. Value Health. 2019;236. [Google Scholar]
- 25. Kleber HD, Weiss RD, Anton RF, et al. Practice Guideline for the Treatment of Patients With Substance Use Disorders. Philadelphia, PA: American Psychiatric Association; 2010. [Google Scholar]
- 26. Gelenberg AJ, Freeman MP, Markowitz JC, et al. Practice Guideline for the Treatment of Patients With Major Depressive Disorder, 4th edn. American Psychiatric Association; 2010. [Google Scholar]
- 27. Trivedi MH, Rush AJ, Wisniewski SR, et al. Evaluation of outcomes with citalopram for depression using measurement‐based care in STAR*D: implications for clinical practice. Am J Psychiatry. 2006;163:28‐40. [DOI] [PubMed] [Google Scholar]
- 28. Kroenke K. Enhancing the clinical utility of depression screening. CMAJ. 2012;184:281‐282. [DOI] [PMC free article] [PubMed] [Google Scholar]
- 29. Quilty L, Robinson J, Rolland J, et al. The structure of the Montgomery‐Åsberg Depression Rating Scale over the course of treatment for depression. Int J Methods Psychiatr Res. 2013;22:175‐184. [DOI] [PMC free article] [PubMed] [Google Scholar]
- 30. Inoue T, Tanaka T, Nakagawa S, et al. Utility and limitations of PHQ‐9 in a clinic specializing in psychiatric care. BMC Psychiatry. 2012;12:73. [DOI] [PMC free article] [PubMed] [Google Scholar]
- 31. Levis B, Benedetti A, Ioannidis JPA, et al. Patient Health Questionnaire‐9 scores do not accurately estimate depression prevalence: individual participant data meta‐analysis. J Clin Epidemiol. 2020;122: 115 ‐ 128.e111. [DOI] [PubMed] [Google Scholar]
- 32. Harvey PD, Jacobson W, Zhong W, et al. Determination of a clinically important difference and definition of a responder threshold for the UCSD performance‐based skills assessment (UPSA) in patients with major depressive disorder. J Affect Disord. 2017;213:105‐111. [DOI] [PubMed] [Google Scholar]
- 33. Ousmen A, Touraine C, Deliu N, et al. Distribution‐ and anchor‐based methods to determine the minimally important difference on patient‐reported outcome questionnaires in oncology: a structured review. Health Qual Life Outcomes. 2018;16:228. [DOI] [PMC free article] [PubMed] [Google Scholar]
- 34. Jayadevappa R, Malkowicz SB, Wittink M, Wein AJ, Chhatre S. Comparison of distribution‐ and anchor‐based approaches to infer changes in health‐related quality of life of prostate cancer survivors. Health Serv Res. 2012;47:1902‐1925. [DOI] [PMC free article] [PubMed] [Google Scholar]
- 35. Katz NP, Paillard FC, Ekman E. Determining the clinical importance of treatment benefits for interventions for painful orthopedic conditions. J Orthop Surg Res. 2015;10:24. [DOI] [PMC free article] [PubMed] [Google Scholar]
- 36. Furukawa TA. Measuring clinical importance in a trial of interventions for mixed urinary incontinence. JAMA. 2020;323:479. [DOI] [PubMed] [Google Scholar]
- 37. Hieronymus F, Jauhar S, Østergaard SD, Young AH. One (effect) size does not fit at all: interpreting clinical significance and effect sizes in depression treatment trials. J Psychopharmacol. 2020;34(10):1074‐1078. [DOI] [PMC free article] [PubMed] [Google Scholar]
- 38. Rush AJ, Thase ME. Improving depression outcome by patient‐centered medical management. Am J Psychiatry. 2018;175:1187‐1198. [DOI] [PubMed] [Google Scholar]
Associated Data
This section collects any data citations, data availability statements, or supplementary materials included in this article.
Supplementary Materials
Figure S1
Data Availability Statement
The data sharing policy of Janssen Pharmaceutical Companies of Johnson & Johnson is available at https://www.janssen.com/clinical‐trials/transparency. As noted on this site, requests for access to the study data can be submitted through Yale Open Data Access (YODA) Project site at http://yoda.yale.edu.