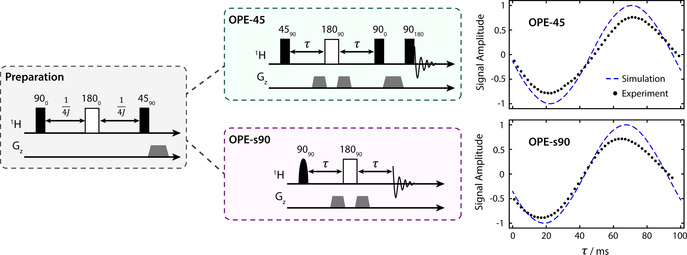
Figure 3.

The rf pulse sequences used in this work. Rectangular boxes represent “hard” (non‐selective) pulses, rounded boxes represent “soft” (selective) pulses, and grey trapezoids represent pulsed field gradients. The malate‐D2 signal integrals are plotted on the right as a function of the τ delay. A simulation of each experiment is shown by the dashed blue line. The simulation and data are normalized to 1, which corresponds to the absolute observable signal if a 45° rf pulse were applied after the preparation sequence. The maximum amplitude of the data is less than 1 because of losses due to relaxation. Error bars have been omitted as they are contained within the plot markers.
