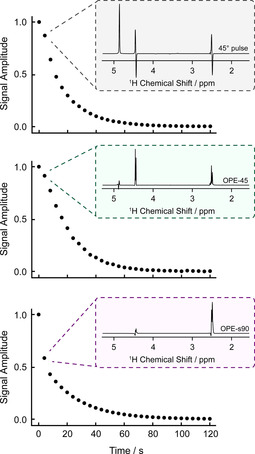
Figure 4.

Integral plots showing decay of the hyperpolarized malate‐D2 signals after shuttling of hyperpolarized fumarate into a solution of fumarase enzyme in D2O. The three experiments each used a different rf pulse method to reveal the malate‐D2 signal after the fumarate landed in the enzyme solution: a 45° pulse, OPE‐45, or OPE‐s90 (as drawn in Figure 3). The rf pulse sequences were applied every 4 s to reveal the malate‐D2 molecules that formed during that time. The spectrum of the second data point is shown for each of the sequences. For the 45° pulse experiment data, the left‐half of the 4.3 ppm peak was integrated.
