Figure 1.

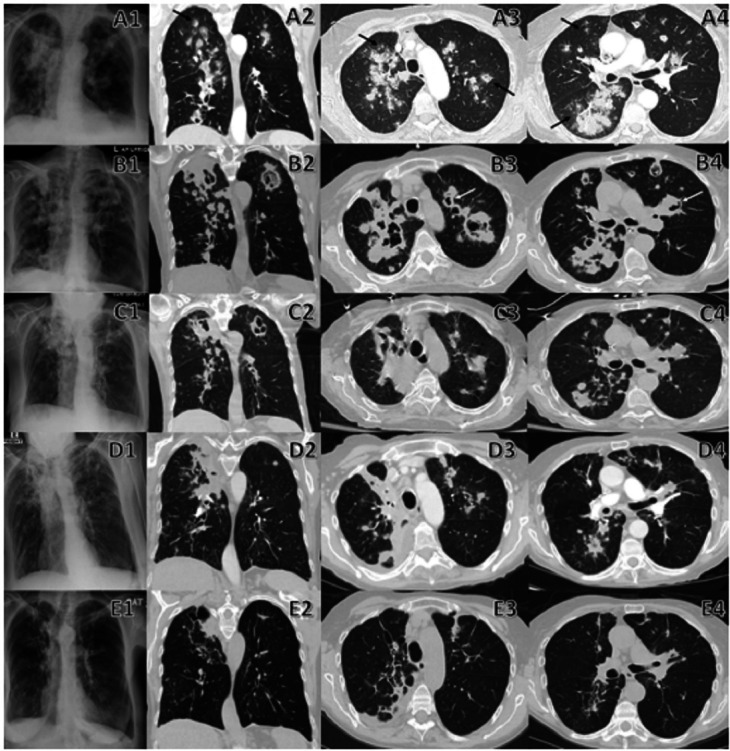
Comparison between initial and follow-up chest imaging. A1–A4 are chest radiograph and CT on admission that demonstrate diffuse nodular lesions in a bronchovascular distribution with halo sign (black arrow) and cavitary lesions. B1–B4 are chest radiograph, and CT performed 3 weeks after initiation of voriconazole therapy revealing progression of initial diffuse nodular lesions which have enlarge/coalesce together to form multiple irregular consolidative masses and many have developed cavitary lesions with air crescent sign (white arrow). There are also new nodular lesions when compared with previous chest imaging. C1–C4 are chest radiograph, and CT performed 3 weeks after initiation of isavuconazonium sulfate therapy that shows the stability of multiple mass-like cavitary lesions where some have regressed in size without new appearing nodular lesions. D1–D4 are chest radiograph, and CT repeated 2 months after initiation of isavuconazonium sulfate therapy showing further regression of multiple mass-like/nodular lesions into linear/wedged-shaped lesions with volume loss. E1–E4 are chest radiograph, and CT repeated 7 months after initiation of isavuconazonium sulfate therapy revealing residual lesions with almost complete resolution of multiple mass-like/nodular lesions into smaller linear lesions, thin-walled cysts and dilated airways (bronchiectasis) that resemble scarring (fibrosis) of lung parenchyma and airways.
