
Figure 2.
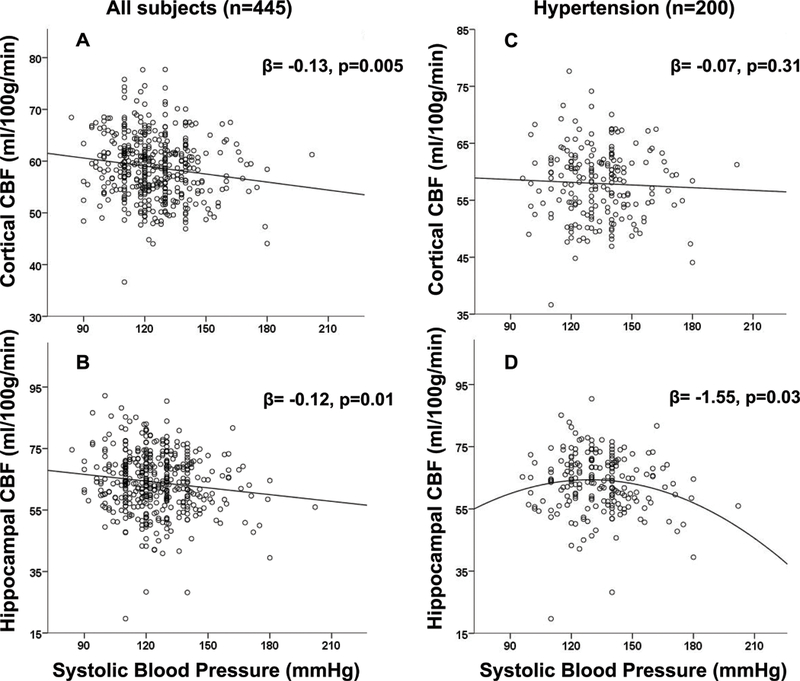
Cortical (A,C) and hippocampal (B,D) CBF as a function of SBP in the entire group (A,B) and among HTN patients (C,D). For panels A, B, C β values from linear regression model with gender included. For panel D from the model with statin use.