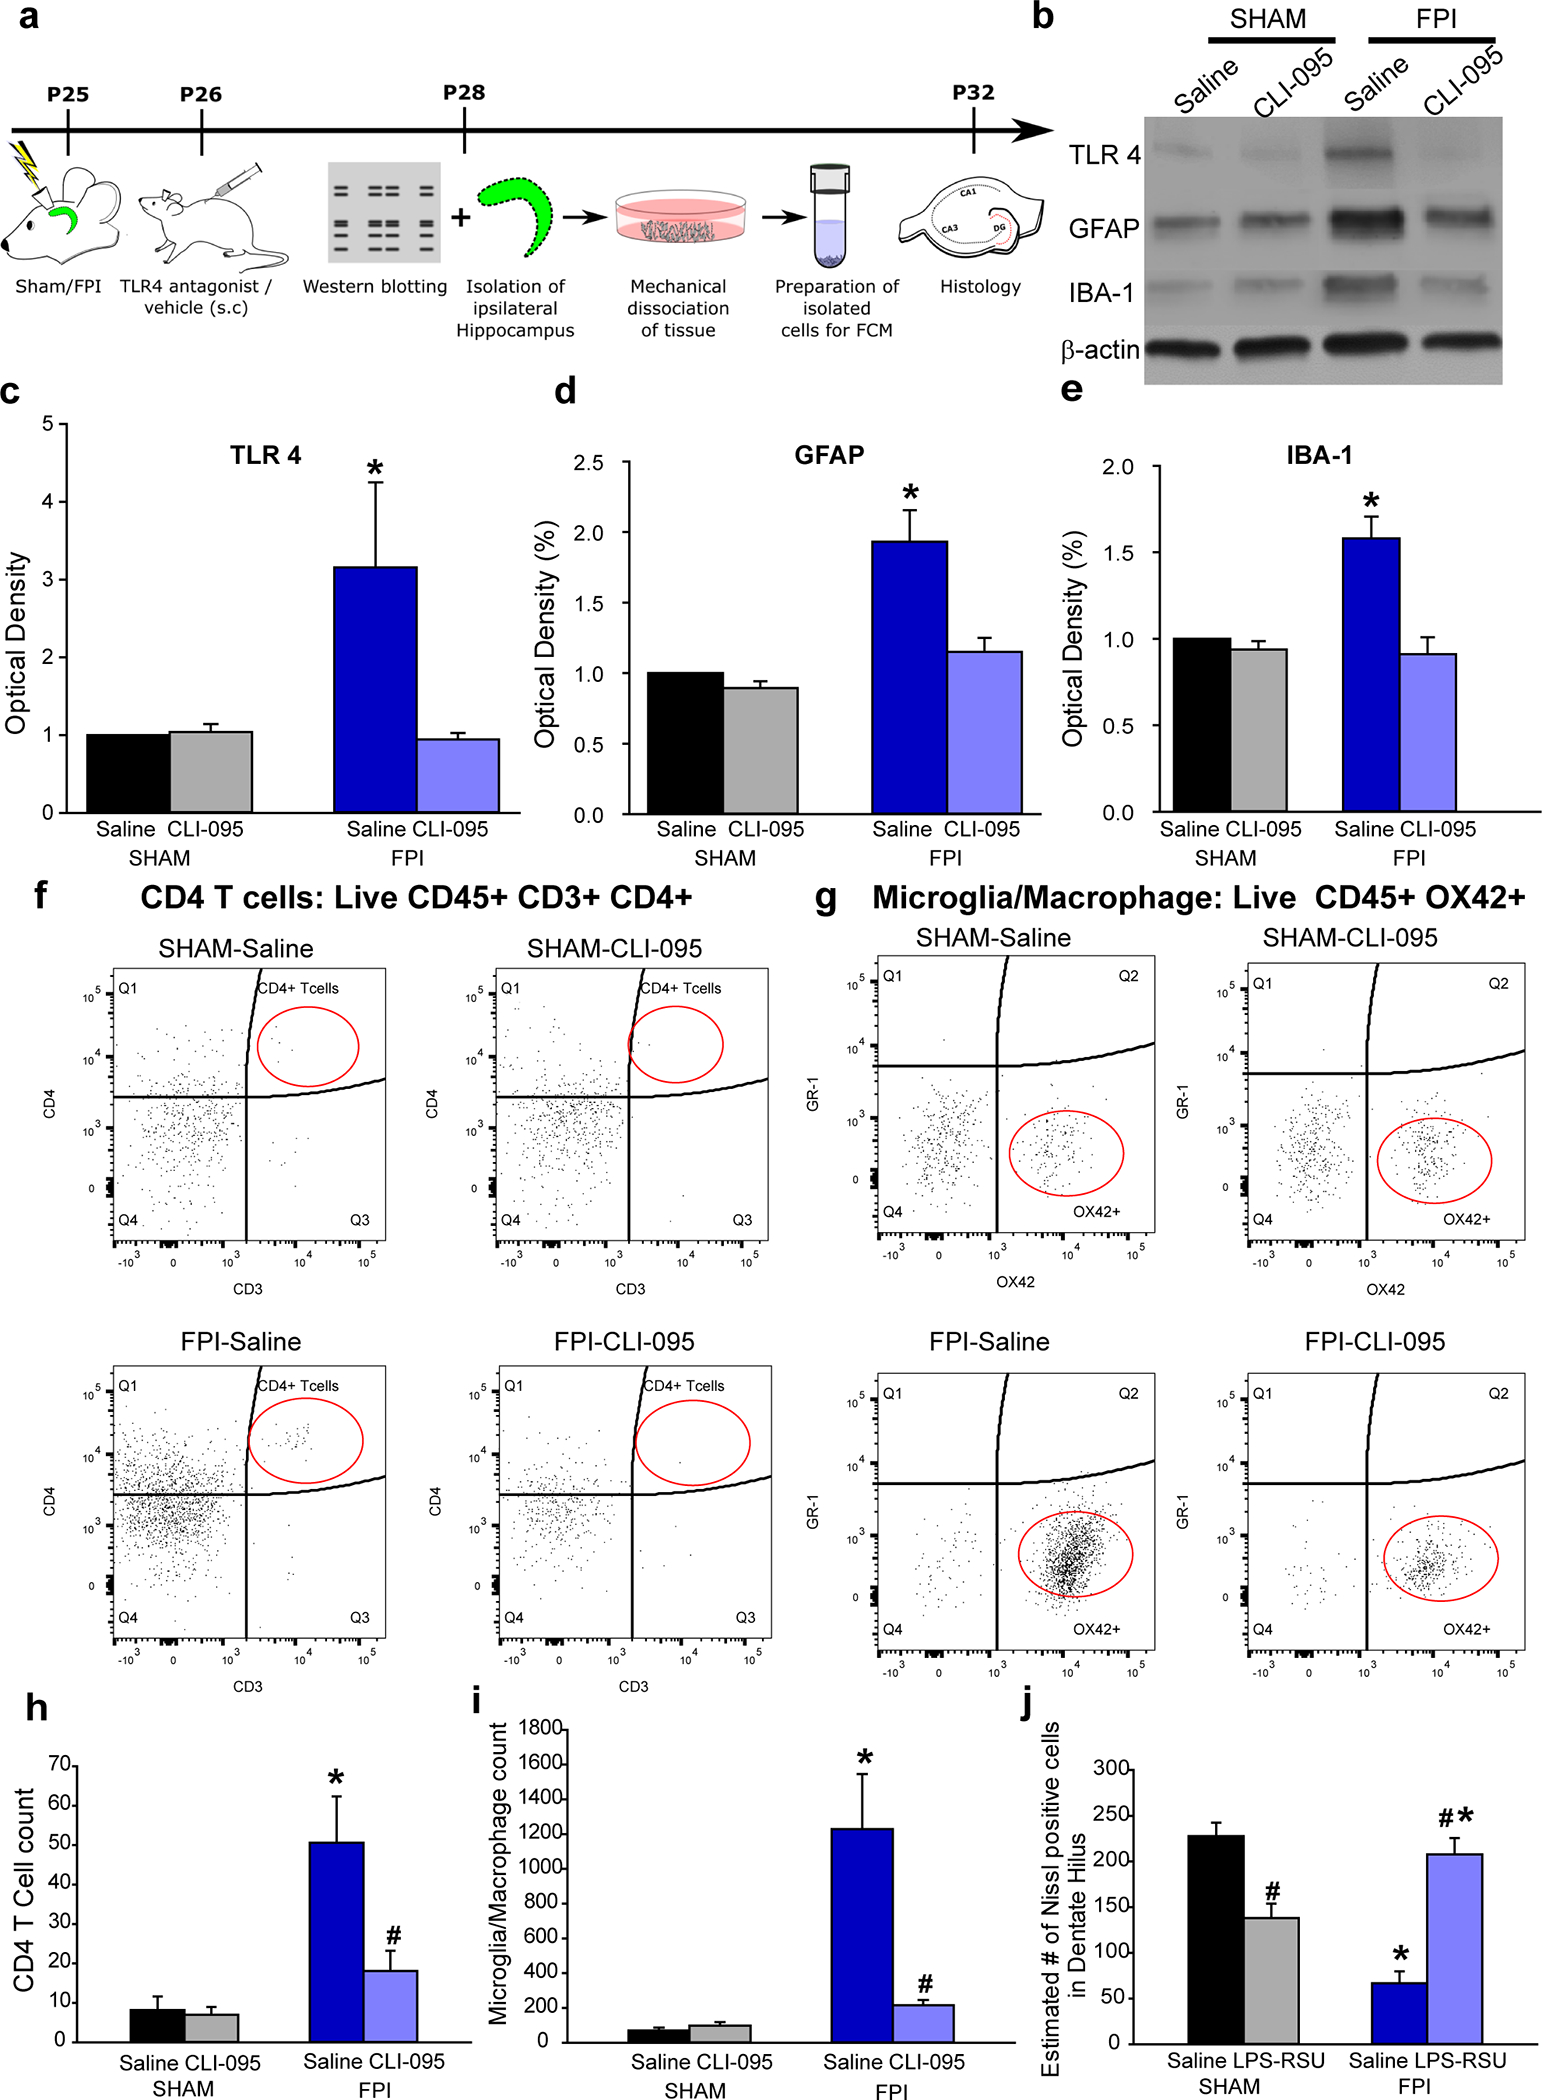
Fig. 7. TLR4 antagonism suppresses cellular inflammation and loss after brain injury without perturbing inflammatory response in uninjured sham rats.

a. Experimental timeline for western blot, flow cytometry and histological studies. b. Representative western blots for TLR4, GFAP and IBA-1 in hippocampal samples from the injured side obtained 3 days after saline/drug treatment. Treatments began 24 hours after injury. Corresponding β-actin bands are illustrated. c-e. Summary histograms of expression of TLR4 (c), GFAP (d) and IBA-1 (e) as a % of the expression levels in sham-saline treated controls. f. Representative CD4/CD3 scatter plots from the hippocampus on the injured side of saline- and (left) and CLI-095 treated (right) sham (above) and brain injured (below) rats. CD4/CD3 scatter plots were gated on live CD45+ cells. The population of interest is noted by the red oval. g. Representative GR-1/Ox42 scatter plots from the hippocampus on the injured side of saline- and (left) and CLI-095 treated (right) sham (above) and brain injured (below) rats. GR-1/OX42 scatter plots were gated on live CD45+ cells. h-i. Quantification of total CD45+CD3+CD4+ T cells (i) and CD45+OX42+ microglia in the experimental groups. Data are presented as mean ± s.e.m., n = 12 animals/treatment (4/group with 3 replicates) * indicates p<0.05 from sham and # indicates p<0.05 compared to saline within injury type by Kruskal-Wallis One Way ANOVA on ranks followed by post-hoc pairwise multiple comparison by Student-Newman-Keuls Method. j. Estimate of Nissl stained cells/ section in the ipsilateral dentate hilus in the experimental groups. n = 11 slices in 3 rats in sham-saline, 11 slices in 3 rats for sham treatment 12 slices in 4 rats from FPI-saline and 11 slices from 4 rats in FPI-treatment. * indicates p<0.05 from sham and # indicates p<0.05 compared to saline within injury type by TW-ANOVA followed by post-hoc Tukey’s test.
