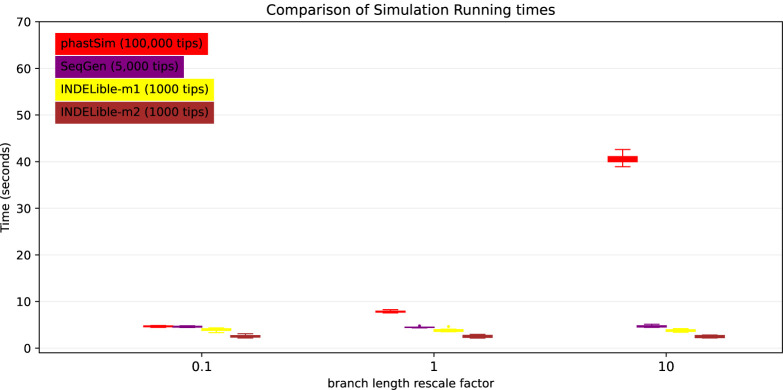
Fig 7. Comparison of running times of different simulators in a SARS-CoV-2 scenario after rescaling the tree branch lengths by different factors.
On the Y axis we show the number of seconds it takes to perform simulations using different software. On the X axis is the rescaling factor we use to make the phylogenetic tree branch lengths longer or shorter. Colors are as in Fig 3. To aid the visual comparison, we use trees of different sizes for different simulators: 1000 tips for INDELible; 5,000 tips for Seq-Gen; 100,000 tips for phastSim.

