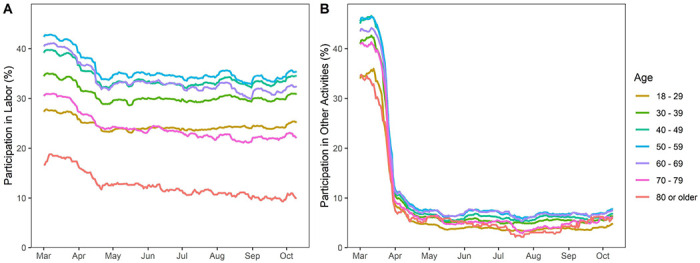
Figure 2: Biweekly participation in labor and other out-of-room activities by age:

Graph shows rolling average participation in activities, defined as whether an individual participated in labor or other activities with at least one other person during any day in the past 2 weeks. Panels show (A) labor participation by age; (B) other participation by age. Data cover all prisons from March 1, 2020 through October 10, 2020.
