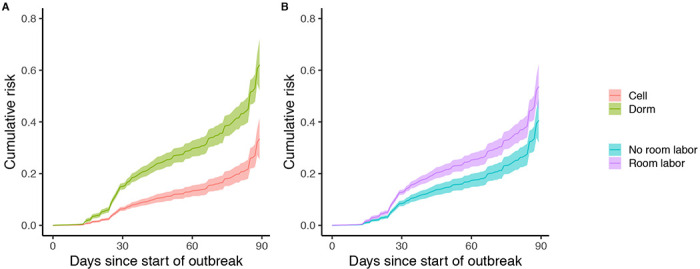
Figure 3. Adjusted cumulative risk of infection in outbreak prisons:

Graphs show the adjusted marginal cumulative risk of infection over 90 days from the start of a prison outbreak for (A) room type and (B) room labor (i.e., whether anyone in the room participated in out-of-room labor). Data includes 90 days follow-up for 9 prisons.
